As we mentioned previously, you’ll be able to interact personally with many of Medical Visualization’s most handsome and knowledgable professors, and even some from medical imaging: Stefan Bruckner, Katja Bühler, Thomas Deserno, Eduard Gröller, Markus Hadwiger, Bernhard Kainz, Wiro Niessen, Bernhard Preim, Timo Ropinski, Thomas Schultz, Anna Vilanova, Rüdiger Westermann and Anders Ynnerman.
Sharing of this post with interested friends and colleagues would be most appreciated! (see the sharing icons right below this)
The Eurographics Association organizes a biannual competition to acknowledge the contribution that computer graphics is playing in the medical field, and to encourage further development. In 2010 the Eurographics Medical Prize was renamed to the Dirk Bartz Prize for Visual Computing in Medicine to honor Dirk Bartz who passed away far too early in March the same year. Dirk was a highly recognized and enthusiastic scientist, teacher and promoter of Visual Computing in Medicine, an active member of the Eurographics Association, and Chair of the EG Medical Prizes 2007 and 2009.
At this year’s Eurographics conference, the three winners of the Dirk Bartz Prize for Visual Computing in Medicine 2015 were announced. The three winning contributions were selected by an international program committee that was chaired by Hans Christian Hege and Timo Ropinski. Based on the reviews of this committee consisting of computer scientists and medical experts, the following ranking was established:
3rd Prize: Multi-Touch Table System for Medical Visualization by Anders Ynnerman, Thomas Rydell, Anders Persson, Aron Ernvik, Camilla Forsell, Patric Ljung, and Claes Lundström
We would like to congratulate all winning teams!
Hugo Talbot (left) receives the first prize from the EG Medical Prize Chairs (Timo Ropinski centre, Hans Christian Hege right) at this year’s EG Medical Prize ceremony.
Yesterday, Christian Rieder of Fraunhofer MEVIS successfully defended his Ph.D. thesis entitled Interactive Visualization for Assistance of Needle-Based Interventions at the Jacobs University Bremen.Supervised by Horst Hahn, Christian made a number of significant contributions in the last years, leading to strong publications at VisWeek and EuroVis, and a MedVis-Award distinction in 2010. Thus, it was not too surprising that the thesis was assessed with the highest possible grade.
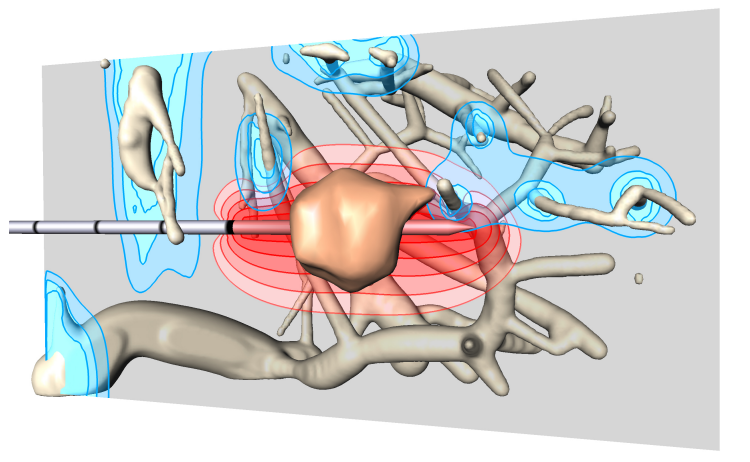
Visualization from Christian’s 2011 VisWeek paper showing RF applicator, tumor, the approximated ablation zone in red and thermal cooling of blood vessels in blue.
Christian’s work aims at supporting clinical workflows, primarily in radio frequency ablation, supporting both the pre-interventional as well as the interventional stage with highly advanced and carefully adapted visualizations indicating tumors, risk structures, security margins as well as results from approximative simulations that predict the thermal lesion produced by RFA. Illustrative techniques, smart map projections, very efficient GPU realizations as well as careful evaluations with relevant physicians are landmarks of Christian’s work, which may be explored on his website in detail.
(editor: Thanks to Prof. Bernhard Preim for submitting this news. We have always been a fan of Christian and his work, and we are very happy to hear of this success!)
In any case, we hope you enjoy reading the preprint, a very compact summary of Medical Visualization developments of the past 30 years and a hint of what the coming decade holds, as much as we enjoyed writing it!
The position has been announced via the jobbnorge-portal, together with a short description of the environment and the plans with regard to the new professor (see also the attached PDF). The application deadline is set to Dec. 22nd, 2011.
(We are happy and grateful that Dr. Steffen Oeltze from the University of Magdeburg Visualization Group could write this short report on the medical visualization session and other medvis-related papers at IEEE VisWeek 2011.)
This year, the IEEE VisWeek has been completed by an excellent session on medical visualization hosting five contributions from three European countries. Roy van Pelt gave a compelling talk on the exploration of cardiovascular 4D MRI blood-flow using stylistic visualizations. His comic-inspired illustrative glyphs coupled with timelines outperform traditional particle renderings. Interactive virtual probing of the flow
avoids a tedious segmentation process in qualitative inspection.
Rostislav Khlebnikov presented a new approach to tumor accessibility planning. It exploits a well-known natural phenomenon related to light scattering at dust particles which is also called crepuscular rays. In the generated 2D/3D images, light beams in different colors that shine through the skin indicate the access paths and their associated risk.
Christian Dick presented new visualization techniques for conveying distances in interactive 3D implant planning. The design of very intuitive distance glyphs and colored slice sets was completed by a carefully accomplished, convincing user study.
Rocco Gasteiger introduced the FlowLens for focus+context visualization of blood flow in cerebral aneurysms. It supports an exploration of certain hemodynamic attributes in the lens region within the context of other attributes thereby avoiding the cognitive effort involved in mental superimposition of side-by-side visualizations. Please watch the supplemental video:
The session was completed by the interesting talk of Artem Amirkhanov on the reduction of metal artifacts in industrial 3D X-ray CT images. He presented a projection-space pipeline in which metal is separated from the other materials before projection and then fused again with the initial reconstruction after projection.
Other talks not being part of the session but also related to medical visualization were given by Claes Lundström on the application of a multi-touch table system to orthopedic surgery planning, Christian Rieder on real-time approximation of the ablation zone for radiofrequency ablation (see the very nice video), Joseph Marino on context preserving maps of tubular structures, e.g., the colon, and Paolo Angelelli on straightening aortic blood flow for side-by-side visualization.
Exposure Render is the open source GPU volume rendering implementation by Thomas Kroes. What makes this different from all other DVR implementations is the fact that it supports physically-based lighting at interactive speeds. So what does all of that mean? It means that you can make incredibly pretty interactive volume renderings on your own PC. See this youtube movie for example:
… or the rendering below (one of my favourites):
Rendering made at interactive speeds from CT data. Note the pretty shadows!
The Medical Visualisation group at the TU Delft currently has a fully funded 4-year Ph.D. vacancy. The successful candidate will work together with another Ph.D. student from the LUMC Departments of Anatomy and Surgery on building the Virtual Surgical Pelvis, a next generation surgical model, in silico, of the human pelvis, based on extremely high resolution histological sections. For more details on the project and the vacancy, see this webpage.
The deadline for applying is May 15, so you better hurry up!
Engadget reports that the virtual autopsy table we posted about in October of last year, is now commercially available from Sectra as the Visual Imaging Table. Get yours now while stocks last.
Chalk another one up for MedVis in the mainstream!