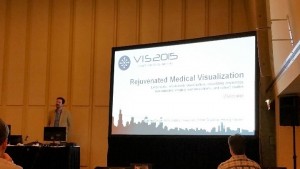
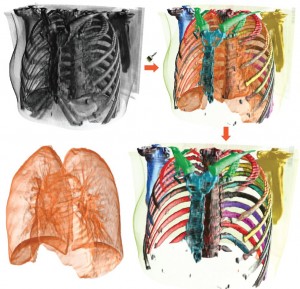
This year IEEE VIS (the conference formerly known as VisWeek) 2015 takes place in Chicago, also known as the “Windy City”. On the first day, I attended a very interesting tutorial about medical visualization entitled “Rejuvenated Medical Visualization”. This tutorial was opened by Steffen Oeltze-Jafra, the organizer of this event. He welcomed the audience and introduced the other speakers in the tutorial: Anders Ynnerman, Stefan Bruckner and Helwig Hauser.
Tag Archives: report
Conference Report: EG VCBM 2015 Chester (UK)
Recently I had the pleasure of attending the Eurographics Workshop on Visual Computing for Biology and Medicine (VCBM) 2015 conference for the third and potentially, but not hopefully, last time. This year it was held in Chester (UK) at The Riverside Innovation Centre at the University of, you guessed it, Chester! In this conference report I will summarize some personal highlights. Repeating last year’s tradition, I again tweeted a picture for almost every talk. I still don’t think Twitter is really gaining traction among the scivis community, and I wonder what it would take to change it (or if it even needs to change ^^). As every year, given the theme of the conference almost every talk is relevant to our medical visualization interests, but I would like to briefly summarize only a couple of them here. Check the full list of papers and posters presented here if this is not enough to satiate your VCBM-craving-needs. Continue reading
VIS 2013 Atlanta Conference Report
(We are very thankful that Dr. Steffen Oeltze from the University of Magdeburg Visualization Group could write this short report on the medical visualization-related papers at IEEE VIS 2013 for us.)
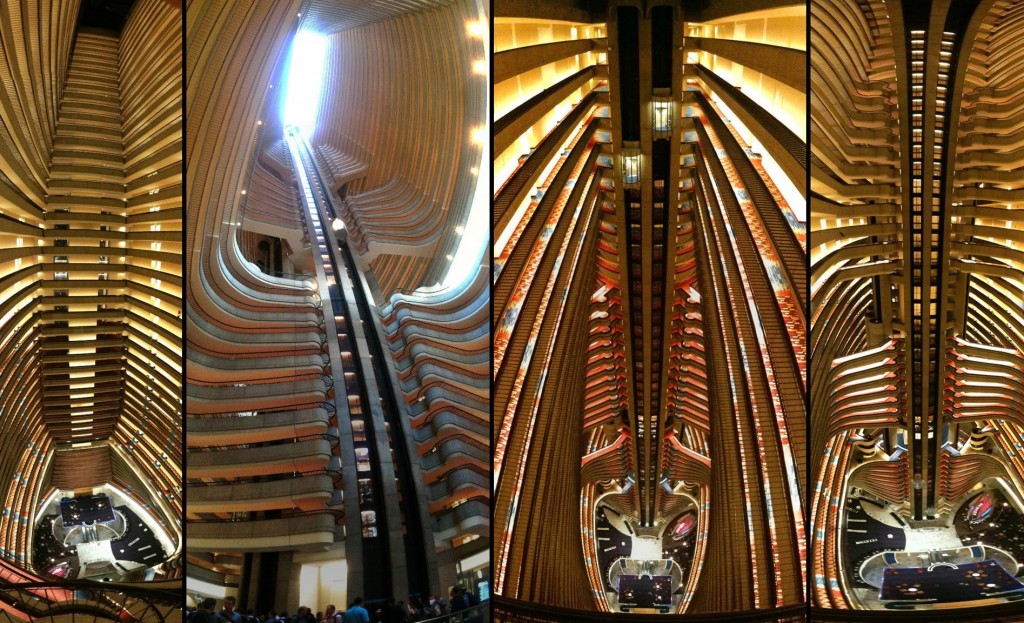
I was very happy to see that in 2013, the IEEE Vis conference hosted again a separate session on biomedical visualization. On top of the five talks given in this session, five more interesting talks, also related to MedVis, were distributed over the conference program. Before the event started, I considered it a good omen that the inwards of the conference hotel looked like a gigantic corpus with the conference attendees accommodated along the costal arches.
The session on biomedical visualization was opened by Jan Kretschmer from the FAU Erlangen and Siemens Healthcare Computed Tomography, Forchheim, Germany. He gave a talk on the interactive patient-specific modeling of vasculature by means of sweep surfaces. He showed how vascular segmentations may be polished in a fast, interactive, and intuitive way such that high-precision models for blood flow simulations are generated on the fly. The modeling approach is robust, eligible for clinical on-site application, and it delivers smooth high quality results.
Xin Zhao from Stony Brook University presented a novel area-preservation mapping/flattening method using the optimal mass transport technique. Compared to previous methods, the size and area of each fold component are preserved facilitating quantitative analyses. Two interesting and very relevant applications from a medical point of view were presented: brain surface flattening and colon flattening. In the former, the correct detection and quantification of brain folds is crucial. Traditional approaches induce severe area distortions and therefore hamper these tasks. In colon flattening, the detection and measurement of polyps benefit from the new method.
A tailor-made algorithm for colon flattening was presented by Krishna Chaitanya Gurijala from Stony Brook University. In contrast to previous approaches, the algorithm is shape-preserving and robust to topological noise. It dispenses denoising the data as a pre-processing step and instead replaces the original Euclidean metric of the colon surface with a heat diffusion metric that is insensitive to topological noise. Virtual colonoscopy greatly benefits from the new approach since shape and area of polyps are preserved.
Thomas Auzinger from the Vienna University of Technology, Austria presented Curved Surface Reformation (CSR) for visualizing a vessels’ interior by generating a view-dependent cut surface through the vasculature. The approach is an advancement compared to Curved Planar Reformation (CPR) and Centerline Reformation (CR) since it handles unrestricted vessel orientation and view direction, it provides a good visibility of the vessels and the surrounding tissue, and it produces results at interactive frame rates. CSR even copes with occlusions of different parts of the vasculature.
Johanna Beyer from Harvard University, Cambridge (previously with the King Abdullah University of Science and Technology (KAUST), Saudi Arabia) concluded the biomedical session. She presented a system for the query-guided visual analysis of large volumetric neuroscience data: the ConnectomeExplorer. The system facilitates the integrated visual analysis of volume data, segmented objects, connectivity information, and additional meta data. Powerful query algebra allows neuroscientists to pose domain-specific questions on the data in an intuitive manner. Johanna’s presentation was completed by an impressive demonstration of the systems performance in typical use-case scenarios.
Moritz Ehlke from the Zuse Institute Berlin presented an approach to render virtual X-ray projections of deformable tetrahedral meshes that runs very fast on the GPU. The purpose of generating these projections is the reconstruction of 3D anatomy from a single or a few 2D X-ray images. In an iterative optimization process, the tetrahedral mesh of a statistical shape and intensity model of an anatomical structure is transformed, such that it represents plausible candidates for a patient-specific shape and density distribution. Each transformation result is then converted to a virtual X-ray projection, whose X-ray attenuation is finally compared to the clinical 2D X-ray. The best candidate provides a plausible representation of 3D anatomy which was demonstrated for the pelvic bone.
Bret Jackson from the University of Minnesota presented a prop-based, tangible interface for 3D interactive visualization of thin fiber structures. He demonstrated the exploration of fiber orientations in second-harmonic generation microscopy of collagen fibers by means of a paper prop, a depth sensing camera, and a low-cost 3D display. The paper prop is tracked and the visualization is restricted to fibers oriented in the direction specified by the prop, i.e. the user. Different gestures, one- and two- handed, are supported for filtering fibers, adjusting the fiber similarity threshold, slicing the volume, and rotating or rolling the volume.
Benjamin Köhler from the Otto-von-Guericke University Magdeburg, Germany gave a talk on the semi-automatic vortex extraction in 4D PC-MRI cardiac blood flow data by means of line predicates. The relation of blood flow patterns, e.g., vortices, and vascular pathologies is currently a hot topic in cardiovascular research. Benjamin compared various vortex extraction methods to determine the most suitable one for cardiac blood flow. He integrated several dedicated flow visualization techniques and the vortex computation in a system that is fully implemented on the GPU to provide real-time feedback. The system was demonstrated based on ten datasets with different pathologies like coarctations, Tetralogy of Fallot and aneurysms and evaluated at the Heart Center Leipzig. A video is available here.
Adrian Maries from the University of Pittsburgh presented GRACE: A visual comparison framework for integrated spatial and non-spatial geriatric data. These high-dimensional data span volumetric images and variables such as age, gender or walking speed. Their concurrent analysis is supported by a multiple coordinated view system comprising volume rendering panels, dendogram panels, and a Kiviat graph. Techniques from statistics are integrated to quantify potential neurology-mobility connections. The usefulness of the framework for generating and refining hypotheses was demonstrated on two case studies. In the paper, the authors report their lessons learned from designing visualizations for concurrently analyzing spatial and non-spatial data. Check the videos here.
Thomas Schultz from the University of Bonn, Germany gave a very good talk on the application of spectral clustering to medical image analysis. He showed a system that makes this powerful and versatile technique more accessible to users via an open-box approach, in which an interactive system visualizes the involved mathematical quantities, suggests clustering parameter values, and provides immediate feedback to support the required decisions, e.g., on the number of clusters. The system further supports the filtering of outliers and the recording of user actions and their translation to other data containing the same structures. Thomas demonstrated the system based on chest CT and brain MRI data.
IEEE PacificVis 2013 Sydney Conference Report
(We are grateful and happy that Alexander Bock, of the Linköping University, Sweden SciVis group could write this short report on the medical visualization-related papers at IEEE PacificVis 2013 for us.)
“Bättre sent än aldrig”, “Besser spät als nie”, “Better late than never”. If a lot of different languages have proverbs for this concept, there must be some truth at the bottom of it. With almost 2 months of delay and after spending the last 2 weeks in PVSD (PostVis Stress Disorder), I will present some of my personal reflections regarding the IEEE PacificVis conference that took place in central Sydney, Australia this year.
The event was hosted by the University of Sydney and three researchers from this university — Peter Eades, Seok-Hee Hong and Karsten Klein were the public faces that guided the conference participants through the event. I am well aware that there are many
andd more people responsible for the organization and execution of the conference and I would like to thank all of those for their splendid work as well. Despite some minor location-related problems — yes, I’m looking at you, projectors! —, the conference was seemingly bug-free and ready to ship! All of the talks at the conference were recorded and I was assured that those videos would see the light of day at some point in the near future. At the time of writing this future has not happened yet, so there will be an update as soon as the presentations are made available.
The greater event started on Tuesday with the opening of the first PacificVAST workshop colocated with PacificVis and a great tutorial on Graph Drawing by Karsten Klein. I can say that for me, as a not graph-ically literate person, it was a very good overview and an even better introduction to the many graph drawing presentations that were to come during the next days. All of the presentations at PacificVAST this year were invited talks, but the organizers are happy to receive nice papers for PacificVAST 2014.
The first day of PacificVis began with a keynote given by Giuseppe Di Battista from the Università Roma Tre, who made one of his few trips outside of Italy to present this insightful thoughts about Graph Animation. Adding the challenge of temporal consistency to the already hard problem of finding good layouts for big graphs was a very interesting topic indeed.
The first two sessions of the day were concerned with “Text and Map Visualization” and “Big Data Visualization”. For brevity’s sake, I’m only highlighting one of the papers, namely “Reordering Massive Sequence Views: Enabling Temporal and Structural Analysis of Dynamic Networks” [1] by Stef van den Elzen et al. from SynerScope and the University of Eindhoven, The Netherlands, since –spoiler-alert– they won the Best Paper Award of the conference. They extended Massive Sequence Views to analyze dynamic networks and enable the user efficiently and effectively detect features in big, time-varying datasets.
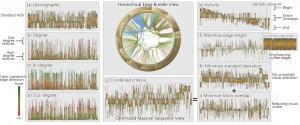
Stef van den Elzen, Danny Holten, Jorik Blaas, and Jarke J. van. Wijk: Reordering Massive Sequence Views: Enabling Temporal and Structural Analysis of Dynamic Networks [1]
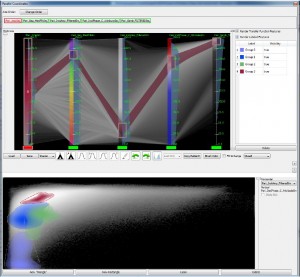
Liang Zhou and Charles Hansen: Transfer Function Design based on User Selected Samples for Intuitive Multivariate Volume Exploration [4].
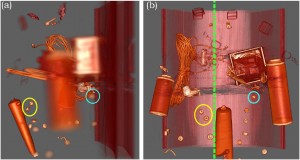
A.V. Pascal Grosset, Mathias Schott, Georges-Pierre Bonneau, and Charles Hansen: Evaluation of Depth of Field for Depth Perception in DVR [5].
The first session of the second day was called “Visualization in Medicine and Natural Sciences” and started with “Guiding Deep Brain Stimulation Interventions by Fusing Multimodal Uncertainty Regions” [7] presented by me, Alexander Bock, from Linköping University, Sweden. So much for objectivity, but I will try nevertheless. In this paper we demonstrated a system to support the surgeon during a Deep Brain Stimulation intervention by showing him/her a combined view of all the measured data along with their associated uncertainty.
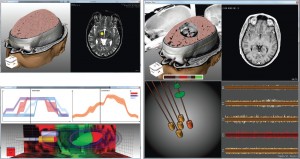
Alexander Bock, Norbert Land, Gianpaolo Evangelista, Ralph Lehrke, and Timo Ropinski: Guiding Deep Brain Stimulation Interventions by Fusing Multimodal Uncertainty Regions [7].
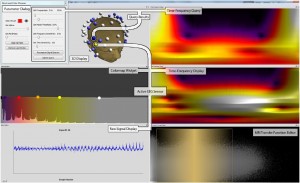
Erik W. Anderson, Catherine Chong, Gilbert A. Preston, and Cláudio T. Silva: Discovering and Visualizing Patterns in EEG Data [8].

Silvia Born, Michael Markl, Matthias Gutberlet, Gerik Scheuermann: Illustrative Visualization of Cardiac and Aortic Blood Flow from 4D MRI Data [9].
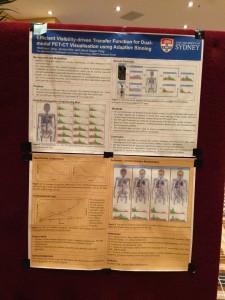
Jung et al.: “Efficient Visibility-driven Transfer Function for Dual-Modal
PET-CT Visualisation using Adaptive Binning” poster.
As this post is already far too long, and none of the remaining sessions (namely: “Time–varying and Multivariate Visualization”, “Visual Analytics”, “Tree and Graph Visualization” and “Vector and Tensor Fields Visualization” contained directly medvis research, I will wrap this one up by thanking all of the speakers and the organizers and by stating that I could unfortunately only present a small subset of all the good papers that were presented at the conference. As soon as the Proceedings are published, I hope that everybody can reach the same conclusion.
- [1] Stef van den Elzen, Danny Holten, Jorik Blaas, and Jarke J. van. Wijk: “Reordering Massive Sequence Views: Enabling Temporal and Structural Analysis of Dynamic Networks.”
- [2] Hanqi Guo and Xiaoru Yuan: “Local WYSIWYG Volume Visualization.” URL: http://vis.pku.edu.cn/research/publication/PacificVis13_ltf.pdf
- [3] Hanqi Guo, Ningyu Mao, and Xiaoru Yuan: “WYSIWYG (What You See is What You Get) Volume Visualization.” URL: http://vis.pku.edu.cn/research/publication/Vis11_wysiwyg-small.pdf
- [4] Liang Zhou and Charles Hansen: “Transfer Function Design based on User Selected Samples for Intuitive Multivariate Volume Exploration.”
- [5] A.V. Pascal Grosset, Mathias Schott, Georges-Pierre Bonneau, and Charles Hansen: “Evaluation of Depth of Field for Depth Perception in DVR.” URL: http://hal.inria.fr/docs/00/76/25/48/PDF/dofEval.pdf
- [6] Steven Martin and Han-Wei Shen: “Transformations for Volumetric Range Distribution Queries.”
- [7] Alexander Bock, Norbert Land, Gianpaolo Evangelista, Ralph Lehrke, and Timo Ropinski: “Guiding Deep Brain Stimulation Interventions by Fusing Multimodal Uncertainty Regions.” URL: http://scivis.itn.liu.se/publications/2013/BLELR13//pavis13-dbs.pdf
- [8] Erik W. Anderson, Catherine Chong, Gilbert A. Preston, and Cláudio T. Silva: “Discovering and Visualizing Patterns in EEG Data.”
- [9] Silvia Born, Michael Markl, Matthias Gutberlet, Gerik Scheuermann: “Illustrative Visualization of Cardiac and Aortic Blood Flow from 4D MRI Data.”
- [10] Silvia Born, Matthias Pfeifle, Michael Markl, Gerik Scheuermann: “Visual 4D MRI Blood Flow Analysis with Line Predicates.” URL: http://ieeexplore.ieee.org/xpl/mostRecentIssue.jsp?punumber=6178307


