About two weeks ago, I was lucky enough to be able to attend Eurographics for the first (hopefully not the last!) time. While in general, there are more graphics than visualization topics presented, there was one tutorial that was highly relevant to my medical visualization interests, and potentially also yours. On the 10th of May, there was an amazing tutorial on Information Theory in Visualization. I will provide a short summary of what went down there:
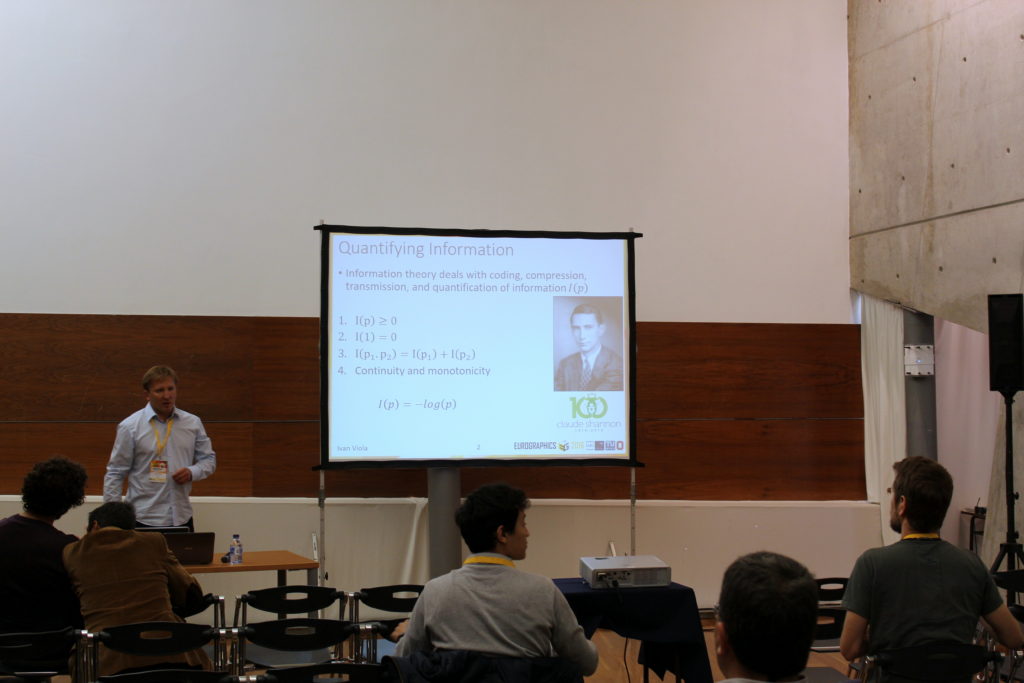
Ivan Viola opened the tutorial with a brief introduction. Information theory deals with coding, compressing, transmission and quantification of information. This can be applied to visualization in many ways, for instance in viewpoint detection, transfer functions design and data fusion. Additionally, it can be used to mathematically confirm the benefit of a visualization.
Anton Bardera prese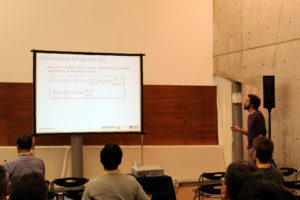 nted an introduction to information theory and explained the key mathematical concepts involved. He explained several measures of information, such as Shannon entropy, conditional entropy, and mutual information, in great detail. After explaining the basics, he provided examples of using entropy and mutual information in viewpoint selection.
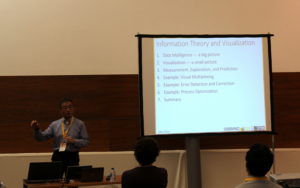 Min Chen presented a general view on how information theory and data intelligence and how this be used to be sure whether a visualization works or not. Furthermore, he presented a concrete example of this based on visual multiplexing. I found the data processing inequality he presented quite intriguing:
No clever manipulation of data can improve the inferences that can be made from the data. – T.M. Cover and J.A. Thomas, Elements of Information Theory, 2006
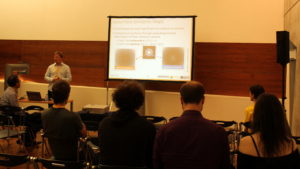 Ivan Viola presented volume visualization-related applications of information theory. In his talk, he covered topics such as time-varying data, level-of-detail selection, iso-surfaces, transfer function specification and multimodal volume visualization.
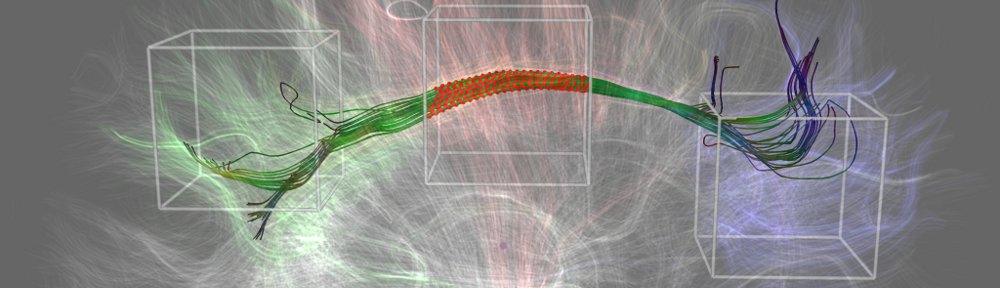
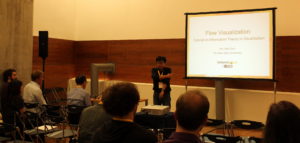 Han-Wei Shen presented information theory applications in flow visualization. He described smart ways of applying information theoretical concepts to flowvis,such as entropy-based seeding for streamline placement, and the Maximal Entropy Projection.
I really enjoyed all four presentations, and this tutorial was definitely one of the Eurographics 2016 highlights for me. The organizers of the tutorial are working on a book on this fascinating topic, so we can look forward to reading more about it soon!