In this new and exciting series at medvis.org we interview fascinating people working in the medical visualization field. First up, we had the pleasure of interviewing Rocco Gasteiger, a successful example of someone making the switch from an academic to an industry-oriented career.
(This news was submitted by the Magedeburg Visualization group. We would like to congratulate Rocco Gasteiger with his outstanding work and his summa cum laude defense!)
Rocco Gasteiger
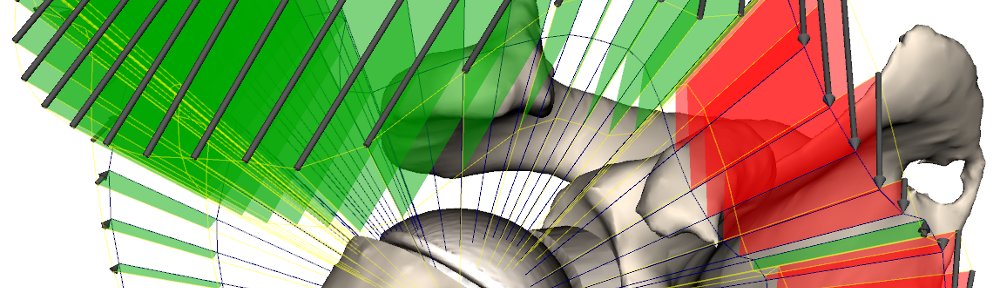
On February 7, 2014 Rocco Gasteiger successfully defended his PhD Thesis “Visual Exploration of Cardiovascular Hemodynamics” with summa cum laude in the Visualization Group (headed by Prof. Bernhard Preim) at the Otto-von-Guericke University (OVGU) Magdeburg. During the work on his PhD Thesis, Rocco provided new contributions to the field of visual exploration of complex morphological and hemodynamic data of cardiovascular diseases with a focus on cerebral aneurysms. In the current clinical and biomedical research, the analysis of measured and simulated blood flow data is of major importance for the examination of diseases, their courses and optimized patient-specific treatment options. The main contributions of the PhD Thesis consist of the development of an expressive visualization method for vessel illustrations with embedded flow information, the automatic extraction of qualitative hemodynamic parameters (see Fig. 1) as well as a flexible focus and context illustration for the examination of multi-parameter data of the hemodynamics (also known as FlowLens).
Automatic extracted and illustratively depicted Visualization of the inflow jet (arrow glyph) and impingement zone (contours) of the blood flow in a cerebral aneurysm.
The articles were published in the well-known Journal IEEE Transactions on Visualization and Computer Graphics (TVCG) and the Eurographics Workshop on Visual Computing in Biology and Medicine (VCBM). The articles resulted from a close cooperation with his colleague Mathias Neugebauer, the Visual Computing group at OVGU (headed by Prof. Holger Theisel) as well as Prof. Anna Vilanova Bartroli (TU Delft) and Dr. Roy van Pelt (TU Eindhoven). Besides the work for his PhD Thesis, Rocco contributed to further topic-related publications as coauthor. Amongst others, his work was recognized by the medvis award (1st price in 2012). This award is offered by the Medical Visualization group of the German Informatics Society (GI) and is sponsored by BrainLab. Furthermore, the joint works of Mathias, Rocco, Gábor Janiga (Institute of Fluid Dynamics and Thermodynamics, OVGU), Oliver Beuing (University Hospital Magdeburg) and Prof. Bernhard Preim received the 2nd Dirk Bartz Prize for Visual Computing in Medicine at Eurographics 2013.
Every two years the VCBM group awards the Karl-Heinz Höhne Award for Medical Visualization to a young scientist in the MedVis field. Candidates for this award focus their innovative research on visualizations clearly related to medical questions.
Teaser image from ‘Automatic Detection and Visualization of Qualitative Hemodynamic Characteristics in Cerebral Aneurysms’ [2].
We would like to congratulate Rocco and the Magdeburg Visualization group with this well-deserved award. If you want to find out more about Rocco’s work, you might want to check out his two IEEE TVCG papers, presented at VisWeek 2011 and 2012:
This year, IEEE VisWeek hosted no special session dedicated to medical visualization but
five contributions to this field were spread over the conference program.
Jian Chen from the University of Maryland gave a talk on how stereo and screen size effect the legibility of three-dimensional streamtube visualizations. The effects were studied in the context of visually exploring dense fiber tracts reconstructed from diffusion magnetic resonance imaging data. A user study comprising 12 participants who had to perform five different tasks, e.g., find the endpoints of fiber tracts and judge if tracts belong to the same bundle, was carried out. In contrast to the initial hypotheses of Chen and
colleagues, completion time did not improve by using a larger display and performance accuracy was even hurt by introducing stereo. See the paper for further exploration of the results [1].
Rocco Gasteiger from the University of Magdeburg, Germany gave a compelling talk on the automatic detection and visualization of qualitative hemodynamic characteristics in cerebral aneurysms. He focused on the so-called inflow jet and the impingement zone, both being characteristics which are correlated with the risk of aneurysm rapture. Special care was taken in generating expressive visualizations of the detected features by means of glyphs, texture, Fresnel shading, and surface contours. The work was rounded off by a user study involving six domain experts who show high interpersonal variance in manually specifying the features but agreed on the good value of the presented visualizations [2]. A supplemental video can be watched here:
Markus Hadwiger from the King Abdullah University of Science and Technology, Saudi Arabia presented the first volume visualization system that scales to petascale volumes imaged as a continuous stream of high-resolution electron microscopy images. Markus and his team developed the system in collaboration with neuroscientists who wish to analyze brain function by measuring large blocks of brain tissue. The system can accept a constant stream of 2D image tiles from a microscope thereby handling missing data naturally and avoiding the expensive computation of any 3D multi-resolution representation such as an octree. A novelty of the system is that most computations are restricted to the currently visible volume data [3]. Watch the accompanying video here:
Alexander Bock from the Linköping University, Sweden presented the ray-casting of high-order finite element (FE) models for visualizing and analyzing strain of the human heart muscle. A straightforward ray-casting approach is inadequate for interactive data exploration due to the computational complexity of transforming the sample points along each ray into the non-uniform grid of the FE model. Hence, Alexander and his colleagues decoupled the expensive transformation from the rendering stage by means of proxy rays cast in FE space, thereby allowing it to be performed within a precomputation stage. The nice work was rounded off by an analysis of the error that is introduced by the presented approach [4].
Gunnar Läthén, also from the Linköping University, Sweden, gave a talk on improving transfer functions for volume rendering blood vessels in computed tomography angiography (CTA) data [5]. These data are acquired by means of injecting a contrast agent, which leads to an enhancement of the vessels. Due to variations in mixture concentration of contrast agent in the blood stream, the enhancement varies locally and transfer function presets often do not yield optimal images. Hence, Gunnar and his colleagues propose an automatic, optimization-based method that shifts transfer function presets to account for general deviations and local variations of the intensity of contrast enhanced blood vessels. The method is illustrated for clinically relevant CT angiography datasets.
(We are happy and grateful that Dr. Steffen Oeltze from the University of Magdeburg Visualization Group could write this short report on the medical visualization session and other medvis-related papers at IEEE VisWeek 2011.)
This year, the IEEE VisWeek has been completed by an excellent session on medical visualization hosting five contributions from three European countries. Roy van Pelt gave a compelling talk on the exploration of cardiovascular 4D MRI blood-flow using stylistic visualizations. His comic-inspired illustrative glyphs coupled with timelines outperform traditional particle renderings. Interactive virtual probing of the flow
avoids a tedious segmentation process in qualitative inspection.
Rostislav Khlebnikov presented a new approach to tumor accessibility planning. It exploits a well-known natural phenomenon related to light scattering at dust particles which is also called crepuscular rays. In the generated 2D/3D images, light beams in different colors that shine through the skin indicate the access paths and their associated risk.
Christian Dick presented new visualization techniques for conveying distances in interactive 3D implant planning. The design of very intuitive distance glyphs and colored slice sets was completed by a carefully accomplished, convincing user study.
Rocco Gasteiger introduced the FlowLens for focus+context visualization of blood flow in cerebral aneurysms. It supports an exploration of certain hemodynamic attributes in the lens region within the context of other attributes thereby avoiding the cognitive effort involved in mental superimposition of side-by-side visualizations. Please watch the supplemental video:
The session was completed by the interesting talk of Artem Amirkhanov on the reduction of metal artifacts in industrial 3D X-ray CT images. He presented a projection-space pipeline in which metal is separated from the other materials before projection and then fused again with the initial reconstruction after projection.
Other talks not being part of the session but also related to medical visualization were given by Claes Lundström on the application of a multi-touch table system to orthopedic surgery planning, Christian Rieder on real-time approximation of the ablation zone for radiofrequency ablation (see the very nice video), Joseph Marino on context preserving maps of tubular structures, e.g., the colon, and Paolo Angelelli on straightening aortic blood flow for side-by-side visualization.