
(We are very thankful that Eric Mörth, PhD candidate at the University of Bergen VisGroup and MMIV, could write this report looking forward to the medical visualization-related papers at IEEE VIS 2020 for us!)
It is this time of the year again. The biggest visualization conference is happening again, and we are all very excited about it. This year VIS is completely virtual which comes with its challenges! For me, one positive side of it is the new VIS2020 virtual webpage. All papers are nicely presented, and it is quite easy to find the papers you are interested in. Nevertheless, I still have the feeling that I would miss something if I don’t go through all the papers and mark the papers which are about medical visualization. This year I thought instead of making a schedule of all medical visualization papers only for myself, I am sharing my schedule with you, so you can enjoy all the great works of the authors as well! I hope to see you all in the Discord channels discussing the awesome papers!
VIS Short Papers
Best Papers:
The Anatomical Edutainer
Marwin Schindler, Hsiang-Yun Wu, Renata Georgia Raidou
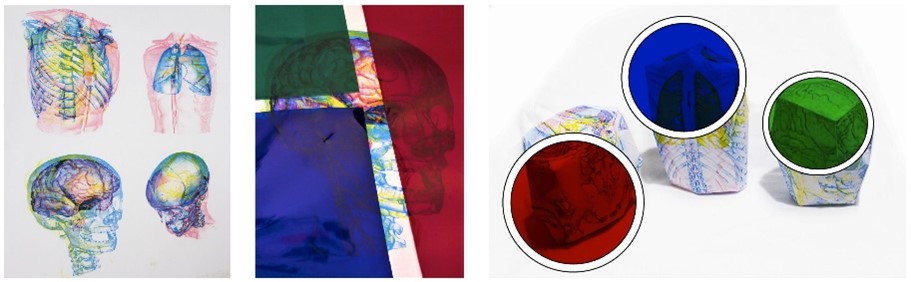
View paper page – View presentation: Tuesday, October 27th, 2020 @ 16:50 GMT+01:00
The authors present a workflow called Anatomical Edutainer, which enables the easy, accessible, and affordable generation of physicalizing for tangible, interactive anatomical edutainment. They use 2D printable and 3D foldable physicalizations which change their visual properties under colored lenses or colored lights.
Visualizing Machine Learning:
Explainable Spatial Clustering: Leveraging Spatial Data in Radiation Oncology
Andrew Wentzel, Guadalupe Canahuate, Lisanne van Dijk, Abdallah Mohamed, Clifton David Fuller, G. Elisabeta Marai
View paper page – View presentation: Friday, October 30th, 2020 @ 16:00 GMT+01:00
The authors deliver a set of lessons learned for creating visual and explainable spatial clustering for clinical users. Their insights were gathered from multi-years collaboration with radiation oncologists and statisticians.
Vis and Scientific Computing
PRAGMA: Interactively Constructing Functional Brain Parcellations
Roza Gunes Bayrak, Nhung Hoang, Colin Blake Hansen, Catie Chang, Matthew Berger
View paper page – View presentation: Tuesday, October 27th, 2020 @ 20:20 GMT+01:00
The authors present PRAGMA, an interactive visualization method that allows domain experts to derive scan-specific parcellations from established atlases. PRAGMA features a hierarchical clustering scheme for defining temporally correlated parcels in varying granularity. The visualization supports the user in deciding on how to perform the clustering. The authors assessed the effectiveness of PRAGMA through a user study with four neuroimaging domain experts.
VIS Full Papers:
Health & Disease
Humane Visual AI: Telling the stories behind a medical condition
Wonyoung So, Edyta Paulina Bogucka, Sanja Scepanovic, Sagar Joglekar, Ke Zhou, Daniele Quercia
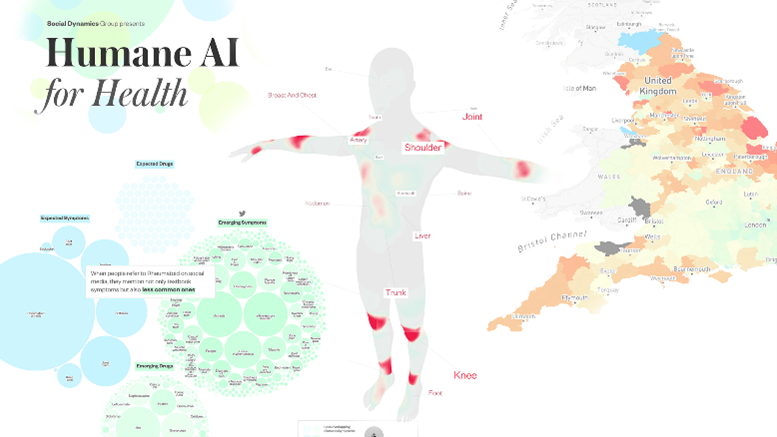
View paper page – View presentation: Friday, October 30th, 2020 @ 15:00 GMT+01:00
The authors mined and combined information from around half a million Reddit posts and open prescription data from the National Health Service in England to visually communicate each of the 14 selected medical condition’s biological, psychological and social aspects through storytelling. A user study with 52 participants delivered interesting insights about the effect of the visualization on them
QualDash: Adaptable Generation of Visualisation Dashboards for Healthcare Quality Improvement
Mai Elshehaly, Rebecca Randell, Matthew Brehmer, Lynn McVey, Natasha Alvarado, Chris P. Gale, Roy Ruddle
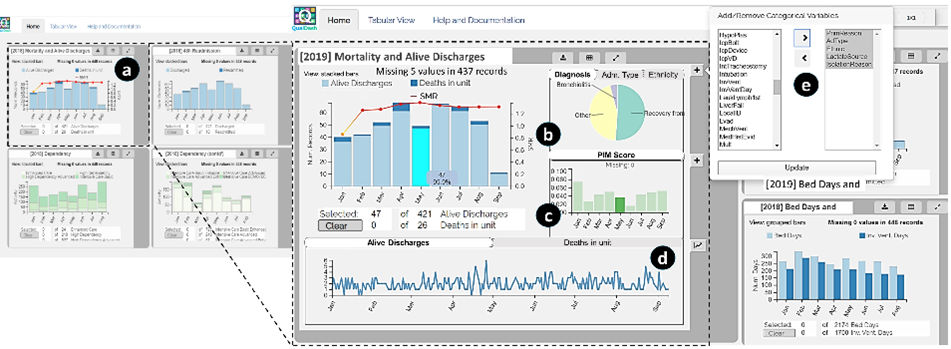
View paper page – View presentation: Friday, October 30th, 2020 @ 15:15 GMT+01:00
The authors present a task analysis that resulted in a metric card metaphor as a unit of visual analysis in healthcare quality improvement. They are using the concept as a building block for generating highly adaptive dashboards and leading to the design of a metric specification structure. QualDash has been deployed in cardiology wards and pediatric intensive care units in five NHS hospitals and the authors report on evaluation results of the usage in a real-world scenario.
Visualization of Human Spine Biomechanics for Spinal Surgery
Pepe Eulzer, Sabine Bauer, Francis Kilian, Kai Lawonn
View paper page – View presentation: Friday, October 30th, 2020 @ 15:30 GMT+01:00
The authors present a visualization application, designed for the exploration of human spine simulation data. The link simulation outcomes with patient-specific anatomy, to make relevant parameters graspable for clinicians, by introducing new concepts to show the directions of impact force vectors. The authors evaluated their application with both surgeons and biomechanical researchers.
In Search of Patient Zero: Visual Analytics of Pathogen Transmission Pathways in Hospitals
Tom Baumgartl, Markus Petzold, Marcel Wunderlich, Markus Höhn, Daniel Archambault, Michael Lieser, Alexander Dalpke, Simone Scheithauer, Michael Marschollek, Vanessa Eichel, Nico T. Mutters, Tatiana von Landesberger
View paper page – View presentation: Friday, October 30th, 2020 @ 15:45 GMT+01:00
The authors present a novel visual analytics approach to support the analysis of transmission pathways, patient contacts, the progression of the outbreak, and patient timelines during hospitalization. In a final study, feedback from twenty-five experts from seven German hospitals provided evidence that their solution brings significant benefits for analyzing pathogen outbreaks.
DPVis: Visual Analytics with Hidden Markov Models for Disease Progression Pathways
Bum Chul Kwon, Vibha Anand, Kristen A Severson, Soumya Ghosh, Zhaonan Sun, Brigitte I Frohnert, Markus Lundgren, Kenney Ng
View paper page – View presentation: Friday, October 30th, 2020 @ 16:00 GMT+01:00
The authors introduce DPVis to integrate model parameters and outcomes of Hidden Markov Models into an interpretable and interactive visualization. The authors state that their tool is successful in evaluating disease progression models, visually summarizing disease states, interactively exploring disease progression patterns, and building, analyzing, and comparing clinically relevant patient subgroups.
Molecules, Cells & Vessels
Visual cohort comparison for spatial single-cell omics-data
Antonios Somarakis, Marieke Ijsselsteijn, Sietse Luk, Boyd Kenkhuis, Noel de Miranda, Boudewijn Lelieveldt, Thomas Höllt
View paper page – View presentation: Wednesday, October 28th, 2020 @ 17:15 GMT+01:00
The authors present an interactive visual analysis workflow for the comparison of cohorts of spatially resolved omics-data. They allow for a comparative analysis of two cohorts based on multiple levels-of-details. The application enables the identification of cohort-differentiating features and outlier samples at any stage of the workflow. The authors conducted multiple case studies with domain experts from different application areas and with different data modalities, to show the effectiveness of the workflow.
Improving the Usability of Virtual Reality Neuron Tracing with Topological Elements
Torin McDonald, Will Usher, Nate Morrical, Attila Gyulassy, Steve Petruzza, Frederick Federer, Alessandra Angelucci, Valerio Pascucci
View paper page – View presentation: Wednesday, October 28th, 2020 @ 17:30 GMT+01:00
The authors propose a new semi-automatic method to guide users in tracing neurons by using topological features. The use of a virtual reality framework which has been used for manual tracing before. In a pilot study, neuroscientists demonstrated a strong preference for their tool over prior approaches. The approach delivered an increased tracing speed while retaining a similar accuracy compared to a fully manual approach.
CMed: Crowd Analytics for Medical Imaging Data
Ji Hwan Park, Saad Nadeem, Saeed Boorboor, Joseph Marino, Arie Kaufman
View paper page – View presentation: Wednesday, October 28th, 2020 @ 17:45 GMT+01:00
The authors present CMed, a visual analytics framework for the exploration of medical image data annotations, acquired from crowdsourcing. They evaluated the efficacy of the framework with two medical crowdsourcing studies and provide expert’s feedback to show the effectiveness of CMed.
Void Space Surfaces to Convey Depth in Vessel Visualizations
Julian Kreiser, Pedro Hermosilla, Timo Ropinski
View paper page – View presentation: Wednesday, October 28th, 2020 @ 18:00 GMT+01:00
The authors propose Void Space Surfaces, a technique that utilizes the empty space in between vessel branches to communicate the depth and their relative positioning. It allows them to improve the depth perception of the vascular structures without interference with the spatial data. Furthermore, the authors deliver two user studies to evaluate the perceptual impact of Void Space Surfaces.
CG&A Full Papers
Towards Better Visual Analysis
Towards Placental Surface Vasculature Exploration in Virtual Reality
Johannes Novotny, Wesley R. Miller, François I. Luks, Derek Merck, Scott Collins, David H. Laidlaw
View paper page – View presentation: Thursday, October 29th, 2020 @ 18:15 GMT+01:00
The authors present a case study where they evaluation the application of virtual reality environments to identify placental surface blood vessels. They observed that the visualization is easy to understand and allows for intuitive exploration, but complex user interactions remained a challenge.
Schedule:
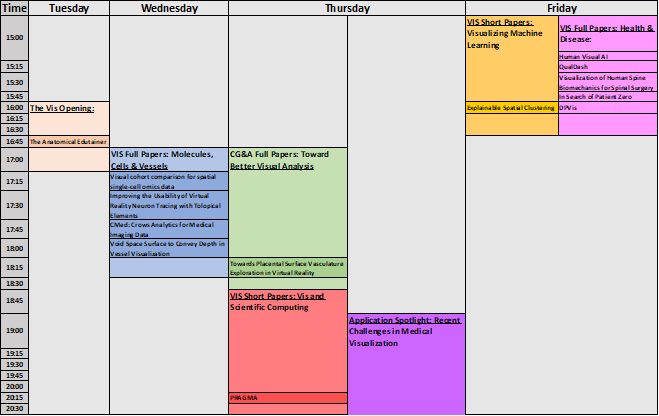
I am looking forward to a successful virtual version of our biggest and most impactful conference, VIS. I hope to see you in one of the Discord channels to discuss all the mentioned papers and to get the feeling of being a part of this year’s VIS conference. Let us hope that future conferences will be in person again to enjoy the experience even more!
See you at VIS2020 😊

