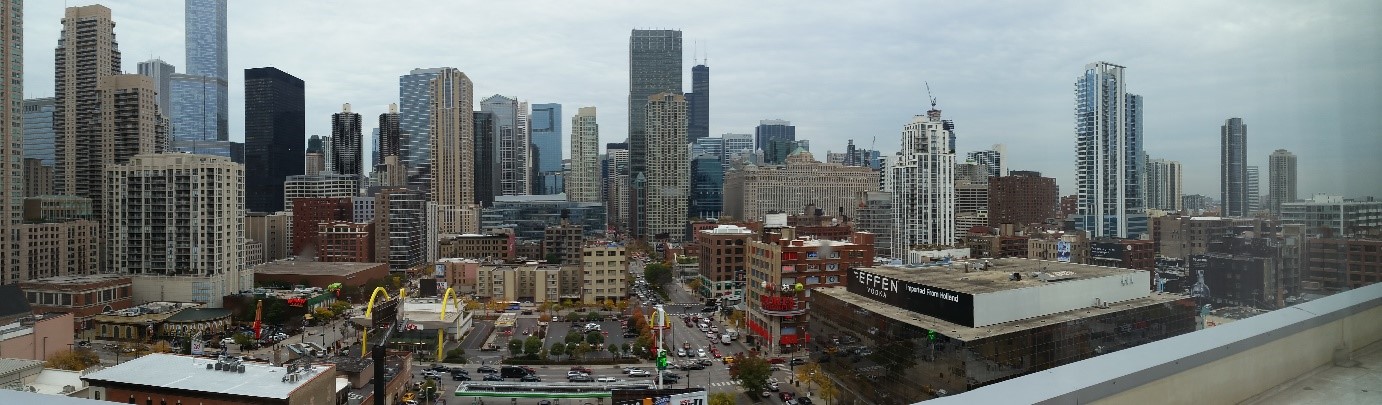
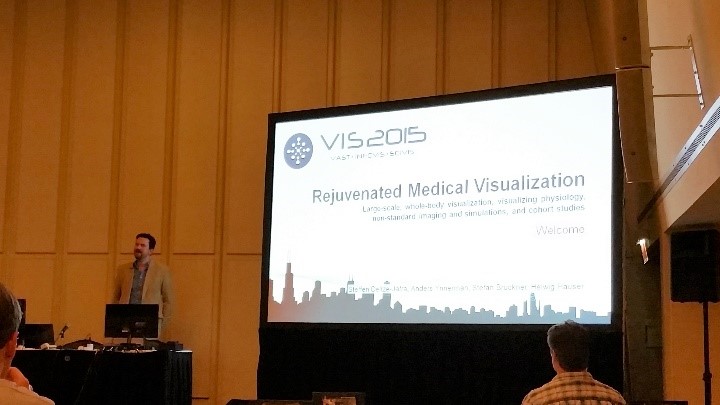
This year IEEE VIS (the conference formerly known as VisWeek) 2015 takes place in Chicago, also known as the “Windy City”. On the first day, I attended a very interesting tutorial about medical visualization entitled “Rejuvenated Medical Visualization”. This tutorial was opened by Steffen Oeltze-Jafra, the organizer of this event. He welcomed the audience and introduced the other speakers in the tutorial: Anders Ynnerman, Stefan Bruckner and Helwig Hauser.
Attending VIS 2015 in Chicago this year? Lucky you! We’ve compiled an overview of papers that sound relevant to our medical visualization interests and have some recommendations on what workshops, tutorials and sessions to attend to maximize your medvis experience. Can’t make it this year? No worries, there will be a full conference report afterwards.
If VA is not your jam, I recommend going to this tutorial: Rejuvenated Medical Visualization—LargeScale, Whole-Body Visualization, Visualizing Physiology, Non-standard imaging and Simulations, and Cohort Studies featuring Steffen Oeltze-Jafra, Anders Ynnerman, Stefan Bruckner and Helwig Hauser from 8:30am–12:10pm at the Monroe. Check the trailer:
In the afternoon you can then stay in the Monroe for the tutorial on Direct Volume Interaction for Visual Data Analysis with Alexander Wiebel, Tobias Isenberg, Stefan Bruckner and Timo Ropinski from 14:00-17:55. There’s a video too:
Monday:
If you’re interested in uncertainty visualization, there is a full day workshop (8:30am-5:55pm) in the Empire room: Visualization for Decision Making Under Uncertainty featuring Kristin Potter, Ruediger Westermann, Christoph Heinzl, Mike Kirby, Ross Whitaker, Eduard Groller, Torsten
Möller and Stefan Bruckner.
If you’re up for some Paraview in the afternoon there is a tutorial (2:00pm-5:55pm) in the Adams room, appropriately entitled The ParaView Tutorial
In the evening (7:00pm-9:00pm) there is a Practicioner event in the Empire, featuring a talk on “Visual Exploration in Surgery Monitoring for Coronary Vessels”:
Tuesday:
The first SciVis session in the State “SciVis Intro + Biomedical and Molecular Visualization (I)” (10:30am-12:10pm) is a definite must-see:
Wednesday morning you have a difficult choice to make ^^, both the SciVis and VAST sessions look interesting:
SciVis in the State: Tasks and Applications (8:30am-10:10am):
A Classification of User Tasks in Visual Analysis of Volume Data (C)
Authors: Bireswar Laha, Doug Bowman, David Laidlaw, John Socha Video Preview
Using Maximum Topology Matching to Explore Differences in Species Distribution Models (C)
Authors: Jorge Poco, Harish Doraiswamy, Marian Talbert, Jeffrey Morisette, Claudio Silva Video Preview
Visual Verification of Space Weather Ensemble Simulations (C)
Authors: Alexander Bock, Asher Pembroke, M. Leila Mays, Lutz Rastaetter, Anders Ynnerman, Timo Ropinski Video Preview
A Visual Voting Framework for Weather Forecast Calibration (C)
Authors: Hongsen Liao, Yingcai Wu, Li Chen, Thomas M. Hamill, Yunhai Wang, Kan Dai, Hui Zhang, Wei Chen Video Preview
Real-time Uncertainty Visualization for B-Mode Ultrasound (C)
Authors: Christian Schulte zu Berge, Denis Declara, Christoph Hennersperger, Maximilian Baust, Nassir Navab
At the same time, the VAST session in the Red room, Visual Analytics in Medicine and Healthcare, also looks tempting (8:30am-10:10am):
Integrating Predictive Analytics into a Spatio-Temporal Epidemic Simulation (C)
Authors: Chris Bryan, Xue Wu, Susan Mniszewski, Kwan-Liu Ma Video Preview
The SciVis sessions after the morning session are
Feature Extraction and Flows (10:30am-12:10pm) and Maps, Geometry and Terrain (4:15pm-5:55pm), neither of which seem to contain any medvis.
Thursday:
Thursday morning starts with another interesting SciVis session in the State room Interfaces, Languages and Systems (8:30am-10:10am):
The CG&A session at the Empire deals with Application-Tailored Visualizations (2:00pm-3:40pm) and features among other topics, this medvis-related paper:
Interactive Visual Analysis of Heterogeneous Cohort Study Data
Authors: Paolo Angelelli, Steffen Oeltze, Judit Haász, Cagatay Turkay, Erlend Hodneland, Arvid Lundervold, Astri J. Lundervold, Bernhard Preim, Helwig Hauser
Friday:
Friday morning starts with part two our favorite session topic Biomedical and Molecular Visualization (II) in the State (8:30am-10:10am):
Exploration of the Brain’s White Matter Structure through Visual Abstraction and Multi-Scale Local Fiber Tract Contraction (T)
Authors: Maarten H. Everts, Henk Bekker, Jos B.T.M. Roerdink, Tobias Isenberg
Medvis.org-contributor Kai Lawonn will be representing team medvis.org at the event, so be sure to go say hi to him if you see him (you might get one of the extremely-limited-edition medvis.org business cards ;)). Besides representing, he’s also presenting his work Tuesday morning in the ‘SciVis Intro + Biomedical and Molecular Visualization
(I)’-session, so don’t miss that one either ^^. I would like to wish all attendees a great time at VIS! Good luck and have fun! For those left behind like me, I can only wish Scivis does a little tweeting for a change 😉
I was very happy to see that in 2013, the IEEE Vis conference hosted again a separate session on biomedical visualization. On top of the five talks given in this session, five more interesting talks, also related to MedVis, were distributed over the conference program. Before the event started, I considered it a good omen that the inwards of the conference hotel looked like a gigantic corpus with the conference attendees accommodated along the costal arches.
The session on biomedical visualization was opened by Jan Kretschmer from the FAU Erlangen and Siemens Healthcare Computed Tomography, Forchheim, Germany. He gave a talk on the interactive patient-specific modeling of vasculature by means of sweep surfaces. He showed how vascular segmentations may be polished in a fast, interactive, and intuitive way such that high-precision models for blood flow simulations are generated on the fly. The modeling approach is robust, eligible for clinical on-site application, and it delivers smooth high quality results.
Xin Zhao from Stony Brook University presented a novel area-preservation mapping/flattening method using the optimal mass transport technique. Compared to previous methods, the size and area of each fold component are preserved facilitating quantitative analyses. Two interesting and very relevant applications from a medical point of view were presented: brain surface flattening and colon flattening. In the former, the correct detection and quantification of brain folds is crucial. Traditional approaches induce severe area distortions and therefore hamper these tasks. In colon flattening, the detection and measurement of polyps benefit from the new method.
A tailor-made algorithm for colon flattening was presented by Krishna Chaitanya Gurijala from Stony Brook University. In contrast to previous approaches, the algorithm is shape-preserving and robust to topological noise. It dispenses denoising the data as a pre-processing step and instead replaces the original Euclidean metric of the colon surface with a heat diffusion metric that is insensitive to topological noise. Virtual colonoscopy greatly benefits from the new approach since shape and area of polyps are preserved.
Johanna Beyer from Harvard University, Cambridge (previously with the King Abdullah University of Science and Technology (KAUST), Saudi Arabia) concluded the biomedical session. She presented a system for the query-guided visual analysis of large volumetric neuroscience data: the ConnectomeExplorer. The system facilitates the integrated visual analysis of volume data, segmented objects, connectivity information, and additional meta data. Powerful query algebra allows neuroscientists to pose domain-specific questions on the data in an intuitive manner. Johanna’s presentation was completed by an impressive demonstration of the systems performance in typical use-case scenarios.
Moritz Ehlke from the Zuse Institute Berlin presented an approach to render virtual X-ray projections of deformable tetrahedral meshes that runs very fast on the GPU. The purpose of generating these projections is the reconstruction of 3D anatomy from a single or a few 2D X-ray images. In an iterative optimization process, the tetrahedral mesh of a statistical shape and intensity model of an anatomical structure is transformed, such that it represents plausible candidates for a patient-specific shape and density distribution. Each transformation result is then converted to a virtual X-ray projection, whose X-ray attenuation is finally compared to the clinical 2D X-ray. The best candidate provides a plausible representation of 3D anatomy which was demonstrated for the pelvic bone.
Bret Jackson from the University of Minnesota presented a prop-based, tangible interface for 3D interactive visualization of thin fiber structures. He demonstrated the exploration of fiber orientations in second-harmonic generation microscopy of collagen fibers by means of a paper prop, a depth sensing camera, and a low-cost 3D display. The paper prop is tracked and the visualization is restricted to fibers oriented in the direction specified by the prop, i.e. the user. Different gestures, one- and two- handed, are supported for filtering fibers, adjusting the fiber similarity threshold, slicing the volume, and rotating or rolling the volume.
Benjamin Köhler from the Otto-von-Guericke University Magdeburg, Germany gave a talk on the semi-automatic vortex extraction in 4D PC-MRI cardiac blood flow data by means of line predicates. The relation of blood flow patterns, e.g., vortices, and vascular pathologies is currently a hot topic in cardiovascular research. Benjamin compared various vortex extraction methods to determine the most suitable one for cardiac blood flow. He integrated several dedicated flow visualization techniques and the vortex computation in a system that is fully implemented on the GPU to provide real-time feedback. The system was demonstrated based on ten datasets with different pathologies like coarctations, Tetralogy of Fallot and aneurysms and evaluated at the Heart Center Leipzig. A video is available here.
Adrian Maries from the University of Pittsburgh presented GRACE: A visual comparison framework for integrated spatial and non-spatial geriatric data. These high-dimensional data span volumetric images and variables such as age, gender or walking speed. Their concurrent analysis is supported by a multiple coordinated view system comprising volume rendering panels, dendogram panels, and a Kiviat graph. Techniques from statistics are integrated to quantify potential neurology-mobility connections. The usefulness of the framework for generating and refining hypotheses was demonstrated on two case studies. In the paper, the authors report their lessons learned from designing visualizations for concurrently analyzing spatial and non-spatial data. Check the videos here.
Thomas Schultz from the University of Bonn, Germany gave a very good talk on the application of spectral clustering to medical image analysis. He showed a system that makes this powerful and versatile technique more accessible to users via an open-box approach, in which an interactive system visualizes the involved mathematical quantities, suggests clustering parameter values, and provides immediate feedback to support the required decisions, e.g., on the number of clusters. The system further supports the filtering of outliers and the recording of user actions and their translation to other data containing the same structures. Thomas demonstrated the system based on chest CT and brain MRI data.