(We are grateful and happy that Alexander Bock, of the Linköping University, Sweden SciVis group could write this short report on the medical visualization-related papers at IEEE PacificVis 2013 for us.)
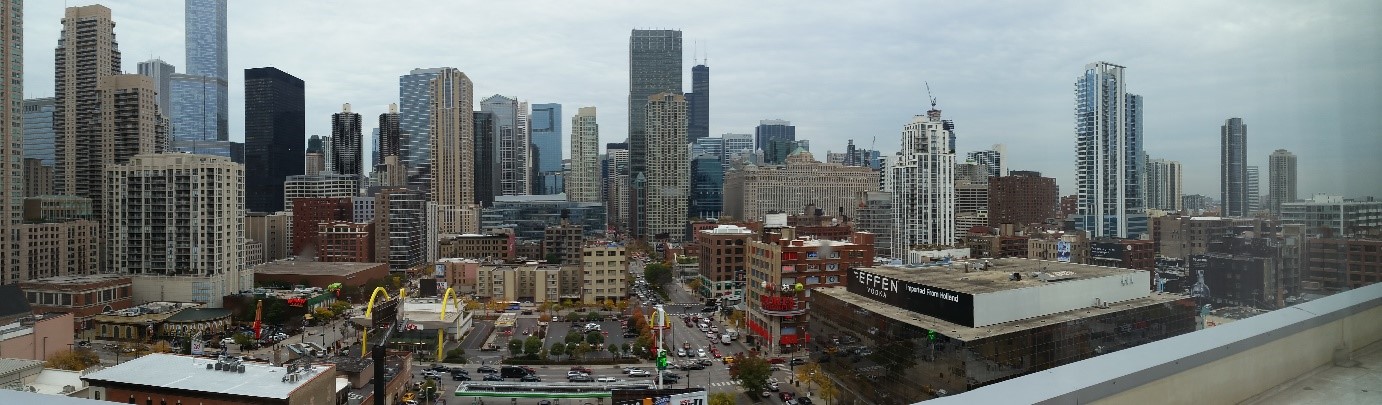
“Bättre sent än aldrig”, “Besser spät als nie”, “Better late than never”. If a lot of different languages have proverbs for this concept, there must be some truth at the bottom of it. With almost 2 months of delay and after spending the last 2 weeks in PVSD (PostVis Stress Disorder), I will present some of my personal reflections regarding the IEEE PacificVis conference that took place in central Sydney, Australia this year.
The event was hosted by the University of Sydney and three researchers from this university — Peter Eades, Seok-Hee Hong and Karsten Klein were the public faces that guided the conference participants through the event. I am well aware that there are many
andd more people responsible for the organization and execution of the conference and I would like to thank all of those for their splendid work as well. Despite some minor location-related problems — yes, I’m looking at you, projectors! —, the conference was seemingly bug-free and ready to ship! All of the talks at the conference were recorded and I was assured that those videos would see the light of day at some point in the near future. At the time of writing this future has not happened yet, so there will be an update as soon as the presentations are made available.
The greater event started on Tuesday with the opening of the first PacificVAST workshop colocated with PacificVis and a great tutorial on Graph Drawing by Karsten Klein. I can say that for me, as a not graph-ically literate person, it was a very good overview and an even better introduction to the many graph drawing presentations that were to come during the next days. All of the presentations at PacificVAST this year were invited talks, but the organizers are happy to receive nice papers for PacificVAST 2014.
The first day of PacificVis began with a keynote given by Giuseppe Di Battista from the Università Roma Tre, who made one of his few trips outside of Italy to present this insightful thoughts about Graph Animation. Adding the challenge of temporal consistency to the already hard problem of finding good layouts for big graphs was a very interesting topic indeed.
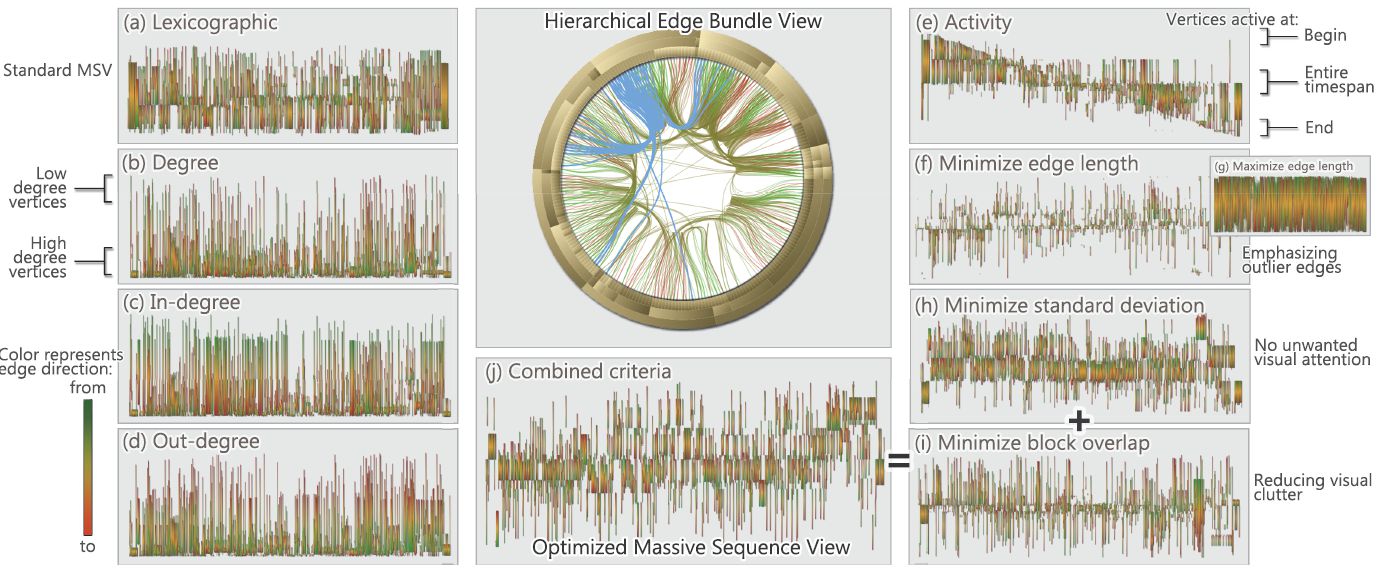
The first two sessions of the day were concerned with “Text and Map Visualization” and “Big Data Visualization”. For brevity’s sake, I’m only highlighting one of the papers, namely “Reordering Massive Sequence Views: Enabling Temporal and Structural Analysis of Dynamic Networks” [1] by Stef van den Elzen et al. from SynerScope and the University of Eindhoven, The Netherlands, since –spoiler-alert– they won the Best Paper Award of the conference. They extended Massive Sequence Views to analyze dynamic networks and enable the user efficiently and effectively detect features in big, time-varying datasets.
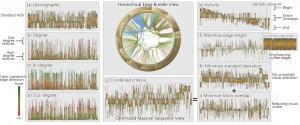
Stef van den Elzen, Danny Holten, Jorik Blaas, and Jarke J. van. Wijk: Reordering Massive Sequence Views: Enabling Temporal and Structural Analysis of Dynamic Networks [1]
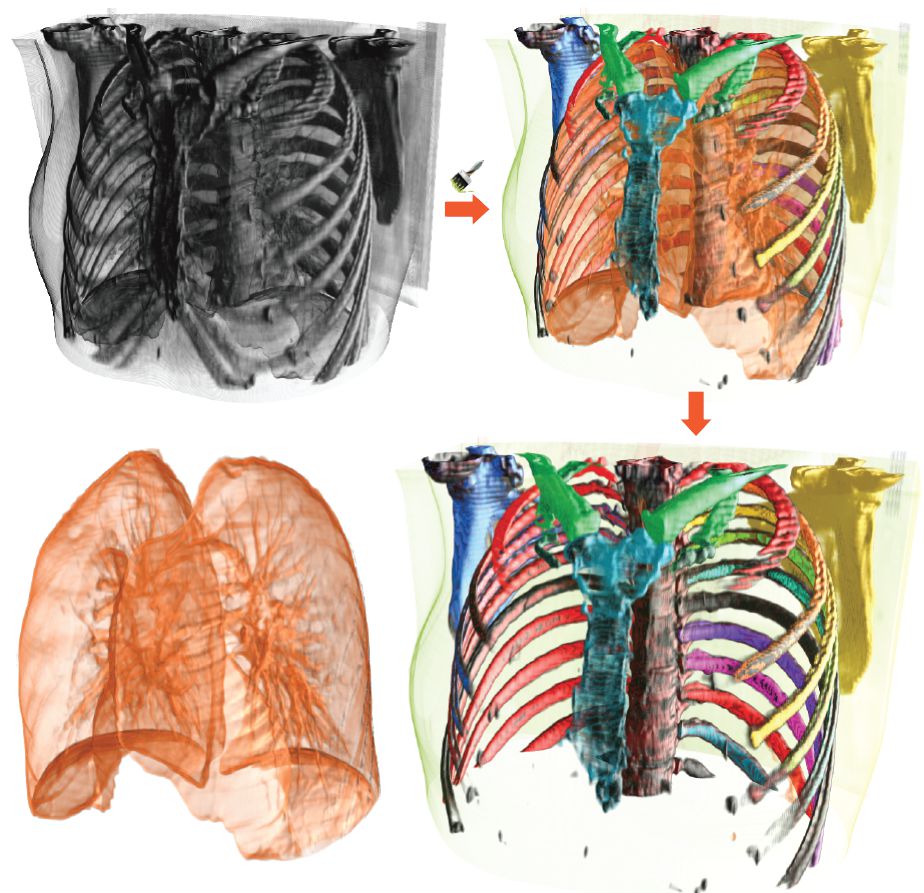
The third session was titled “Volume Rendering” and featured four very nice papers. “Local WYSIWYG Volume Visualization” [2] by Guo and Yuan from the Peking University, China is an improvement of their Vis 2011 paper “WYSIWYG (What You See is What You Get) Volume Visualization” [3], which applies the in-place, stroke-based editing to general spatially localized transfer functions.

Hanqi Guo and Xiaoru Yuan: Local WYSIWYG Volume Visualization [2].
The second paper called “Transfer Function Design based on User Selected Samples for Intuitive Multivariate Volume Exploration” [4] by Zhou and Hansen from the SCI Institute, University of Utah, USA, uses user selected samples in multivariate data to generate high dimensional transfer functions and allows the user to improve this transfer function with brushing and linking.

Liang Zhou and Charles Hansen: Transfer Function Design based on User Selected Samples for Intuitive Multivariate Volume Exploration [4].
“Evaluation of Depth of Field for Depth Perception in DVR” [5] by Grosset et al., also from the SCI Insitute, is a very nice evaluation of using Depth of Field effects in Direct Volume Rendering contexts. Requiring the user to depth-sort points in a rendering, they found that using a Depth of Field rendering technique is not always beneficial. In fact, DoF is beneficial if the feature is close to the camera, but the user performs worse in this task if the feature is at the far end of the object.
A.V. Pascal Grosset, Mathias Schott, Georges-Pierre Bonneau, and Charles Hansen: Evaluation of Depth of Field for Depth Perception in DVR [5].
The last paper in this session was “Transformations for Volumetric Range Distribution Queries” [6] by Martin and Shen from The Ohio State University, USA. They use a pre-processing step on big, volumetric data to allow for fast and efficient range queries during the rendering.
Steven Martin and Han-Wei Shen: Transformations for Volumetric Range Distribution Queries [6].
The second day of the conference was started by the second keynote given by Chuck Hansen from the SCI Insitute, University of Utah. His topic of choice “Big Data: A Scientific Visualization Perspective” shed light on the Post-Petascale era of Scientific Visualization that is soon to come. As computing power increases exponentially not only for visualization researchers but also for the researchers who are writing physical simulations, the amount of data that experts have to be able to handle and analyze will increase exponentially as well. Glorious times ahead!
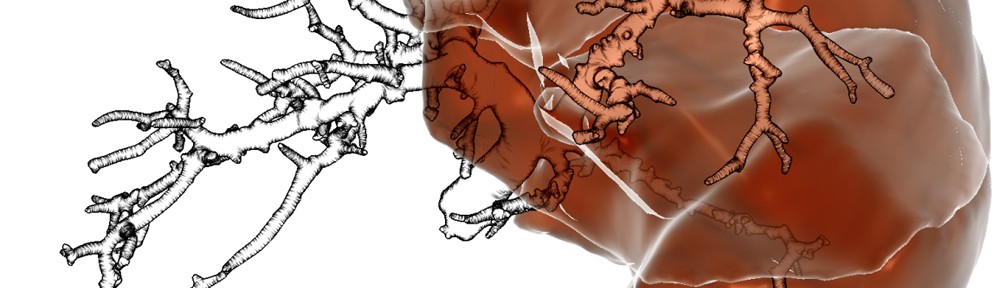
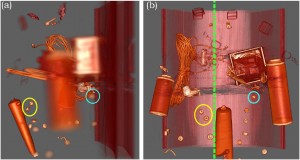
The first session of the second day was called “Visualization in Medicine and Natural Sciences” and started with “Guiding Deep Brain Stimulation Interventions by Fusing Multimodal Uncertainty Regions” [7] presented by me, Alexander Bock, from Linköping University, Sweden. So much for objectivity, but I will try nevertheless. In this paper we demonstrated a system to support the surgeon during a Deep Brain Stimulation intervention by showing him/her a combined view of all the measured data along with their associated uncertainty.
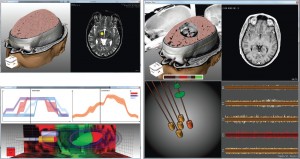
Alexander Bock, Norbert Land, Gianpaolo Evangelista, Ralph Lehrke, and Timo Ropinski: Guiding Deep Brain Stimulation Interventions by Fusing Multimodal Uncertainty Regions [7].
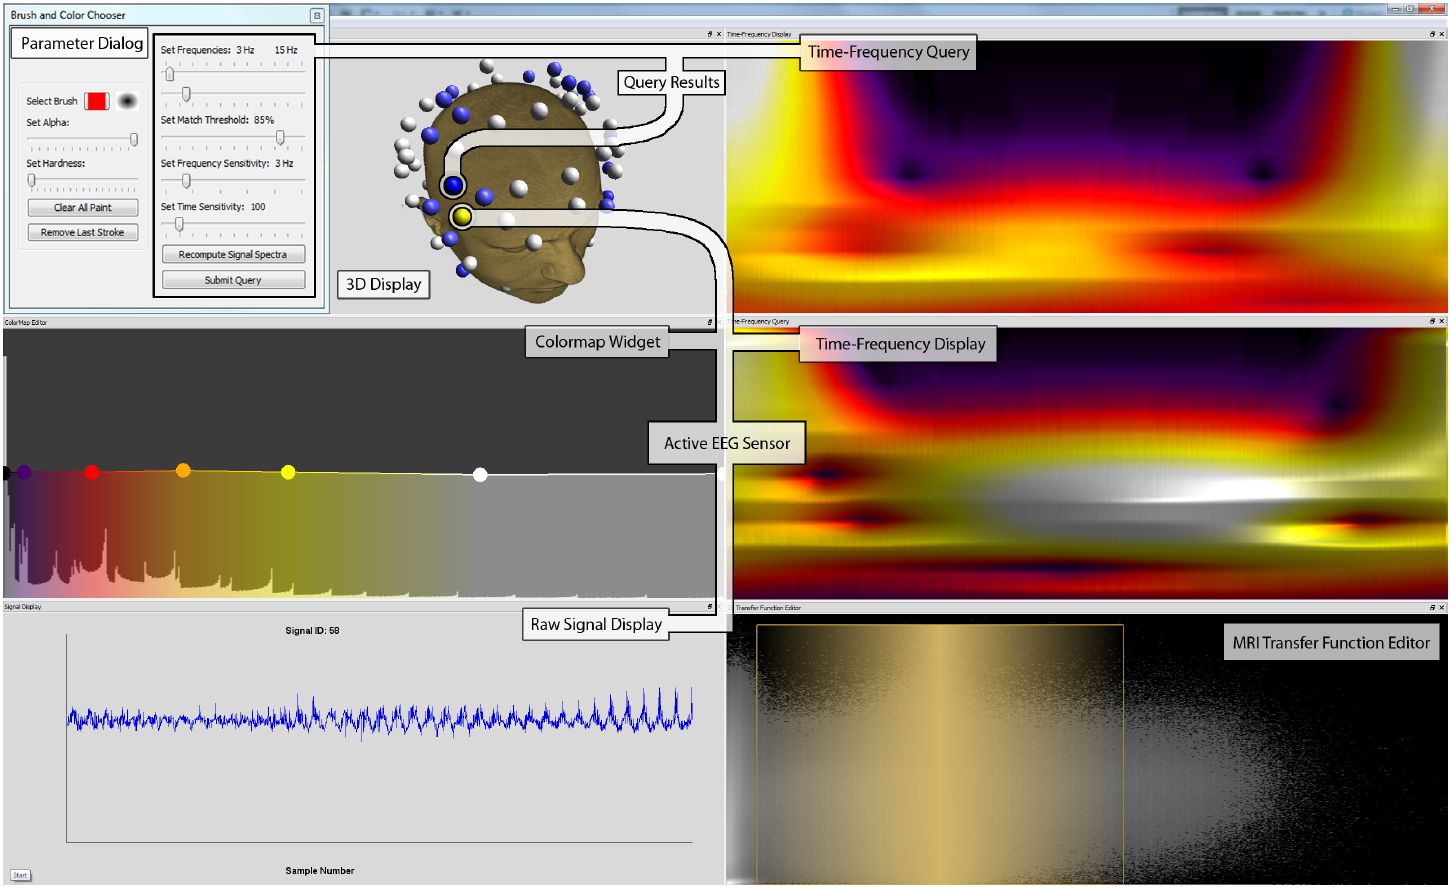
The second paper in this session was “Discovering and Visualizing Patterns in EEG Data” [8] by Anderson et al. from the University of Utah. They had very high-dimensional EEG data from various patient trials and use cross-correlations and pattern detection to generate a spatio-temporal visualization to allow the expert to detect relationships between signals.

Erik W. Anderson, Catherine Chong, Gilbert A. Preston, and Cláudio T. Silva: Discovering and Visualizing Patterns in EEG Data [8].
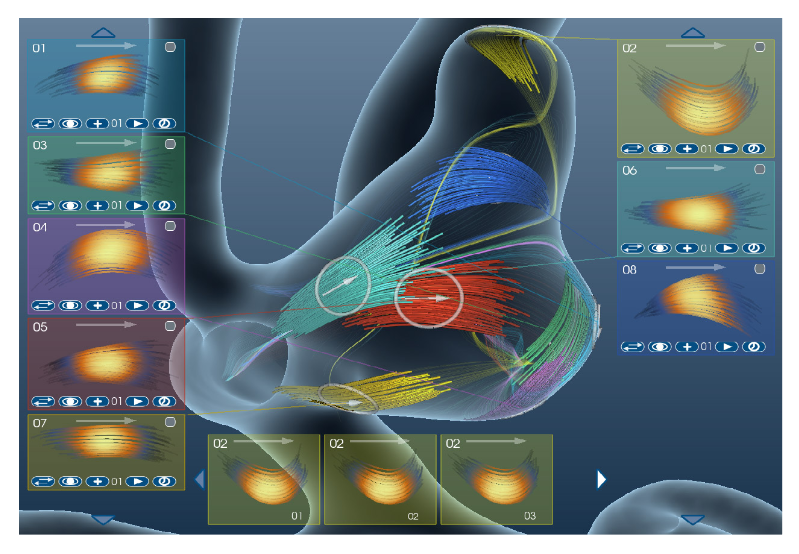
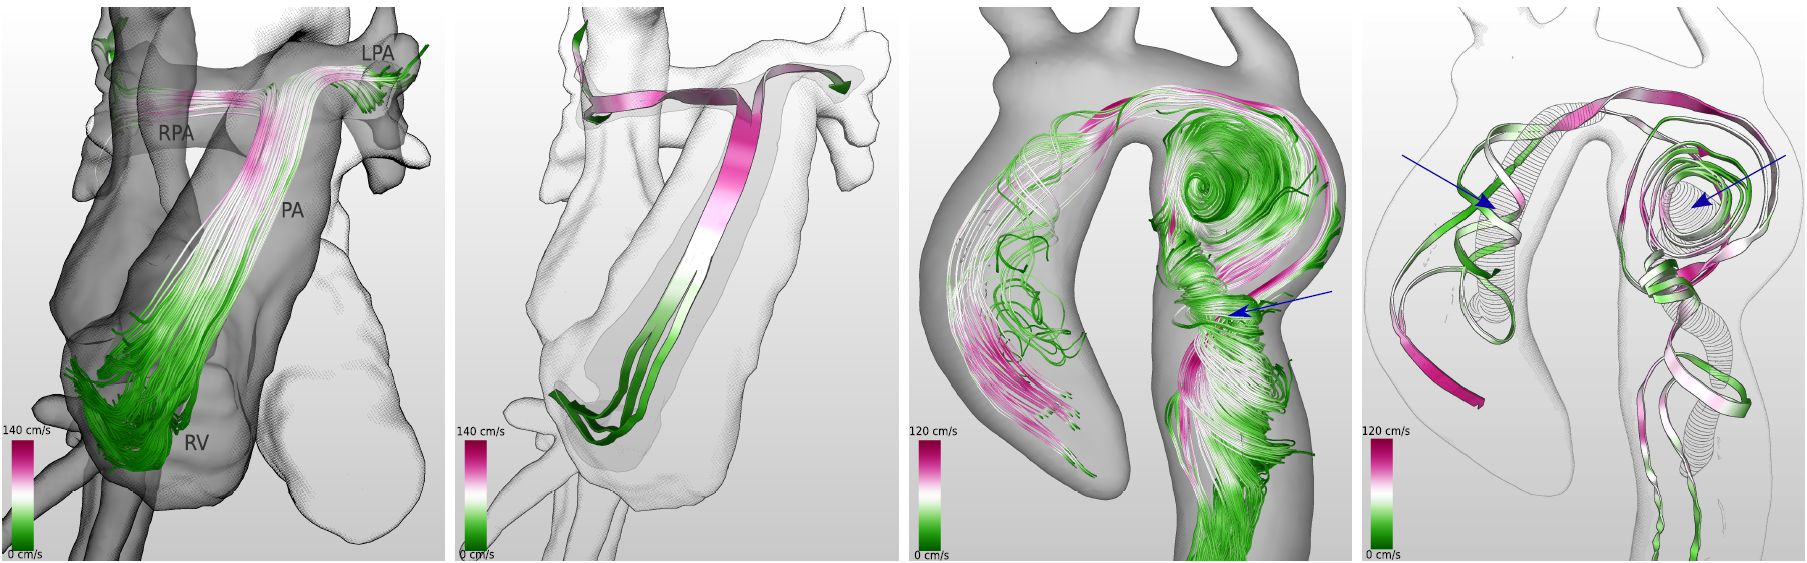
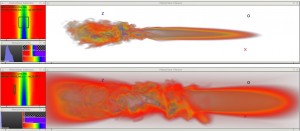
Following two non-medical papers, Silvia Born from the University of Leipzig, Germany, presented her paper “Illustrative Visualization of Cardiac and Aortic Blood Flow from 4D MRI Data” [9]. In this work she generates simple and illustrative visualizations of blood flow patterns based on 4D MRI data. Extending her work “Visual 4D MRI Blood Flow Analysis with Line Predicates” from PacificVis 2012 [10], she created an even more intuitive and easy-to-understand rendering of the measured velocity vector field.
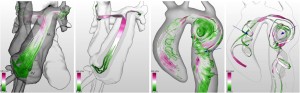
Silvia Born, Michael Markl, Matthias Gutberlet, Gerik Scheuermann: Illustrative Visualization of Cardiac and Aortic Blood Flow from 4D MRI Data [9].
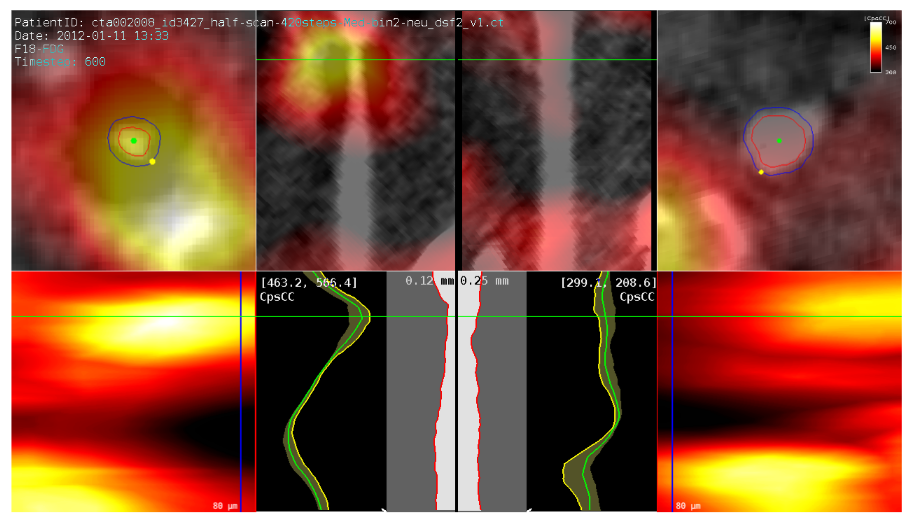
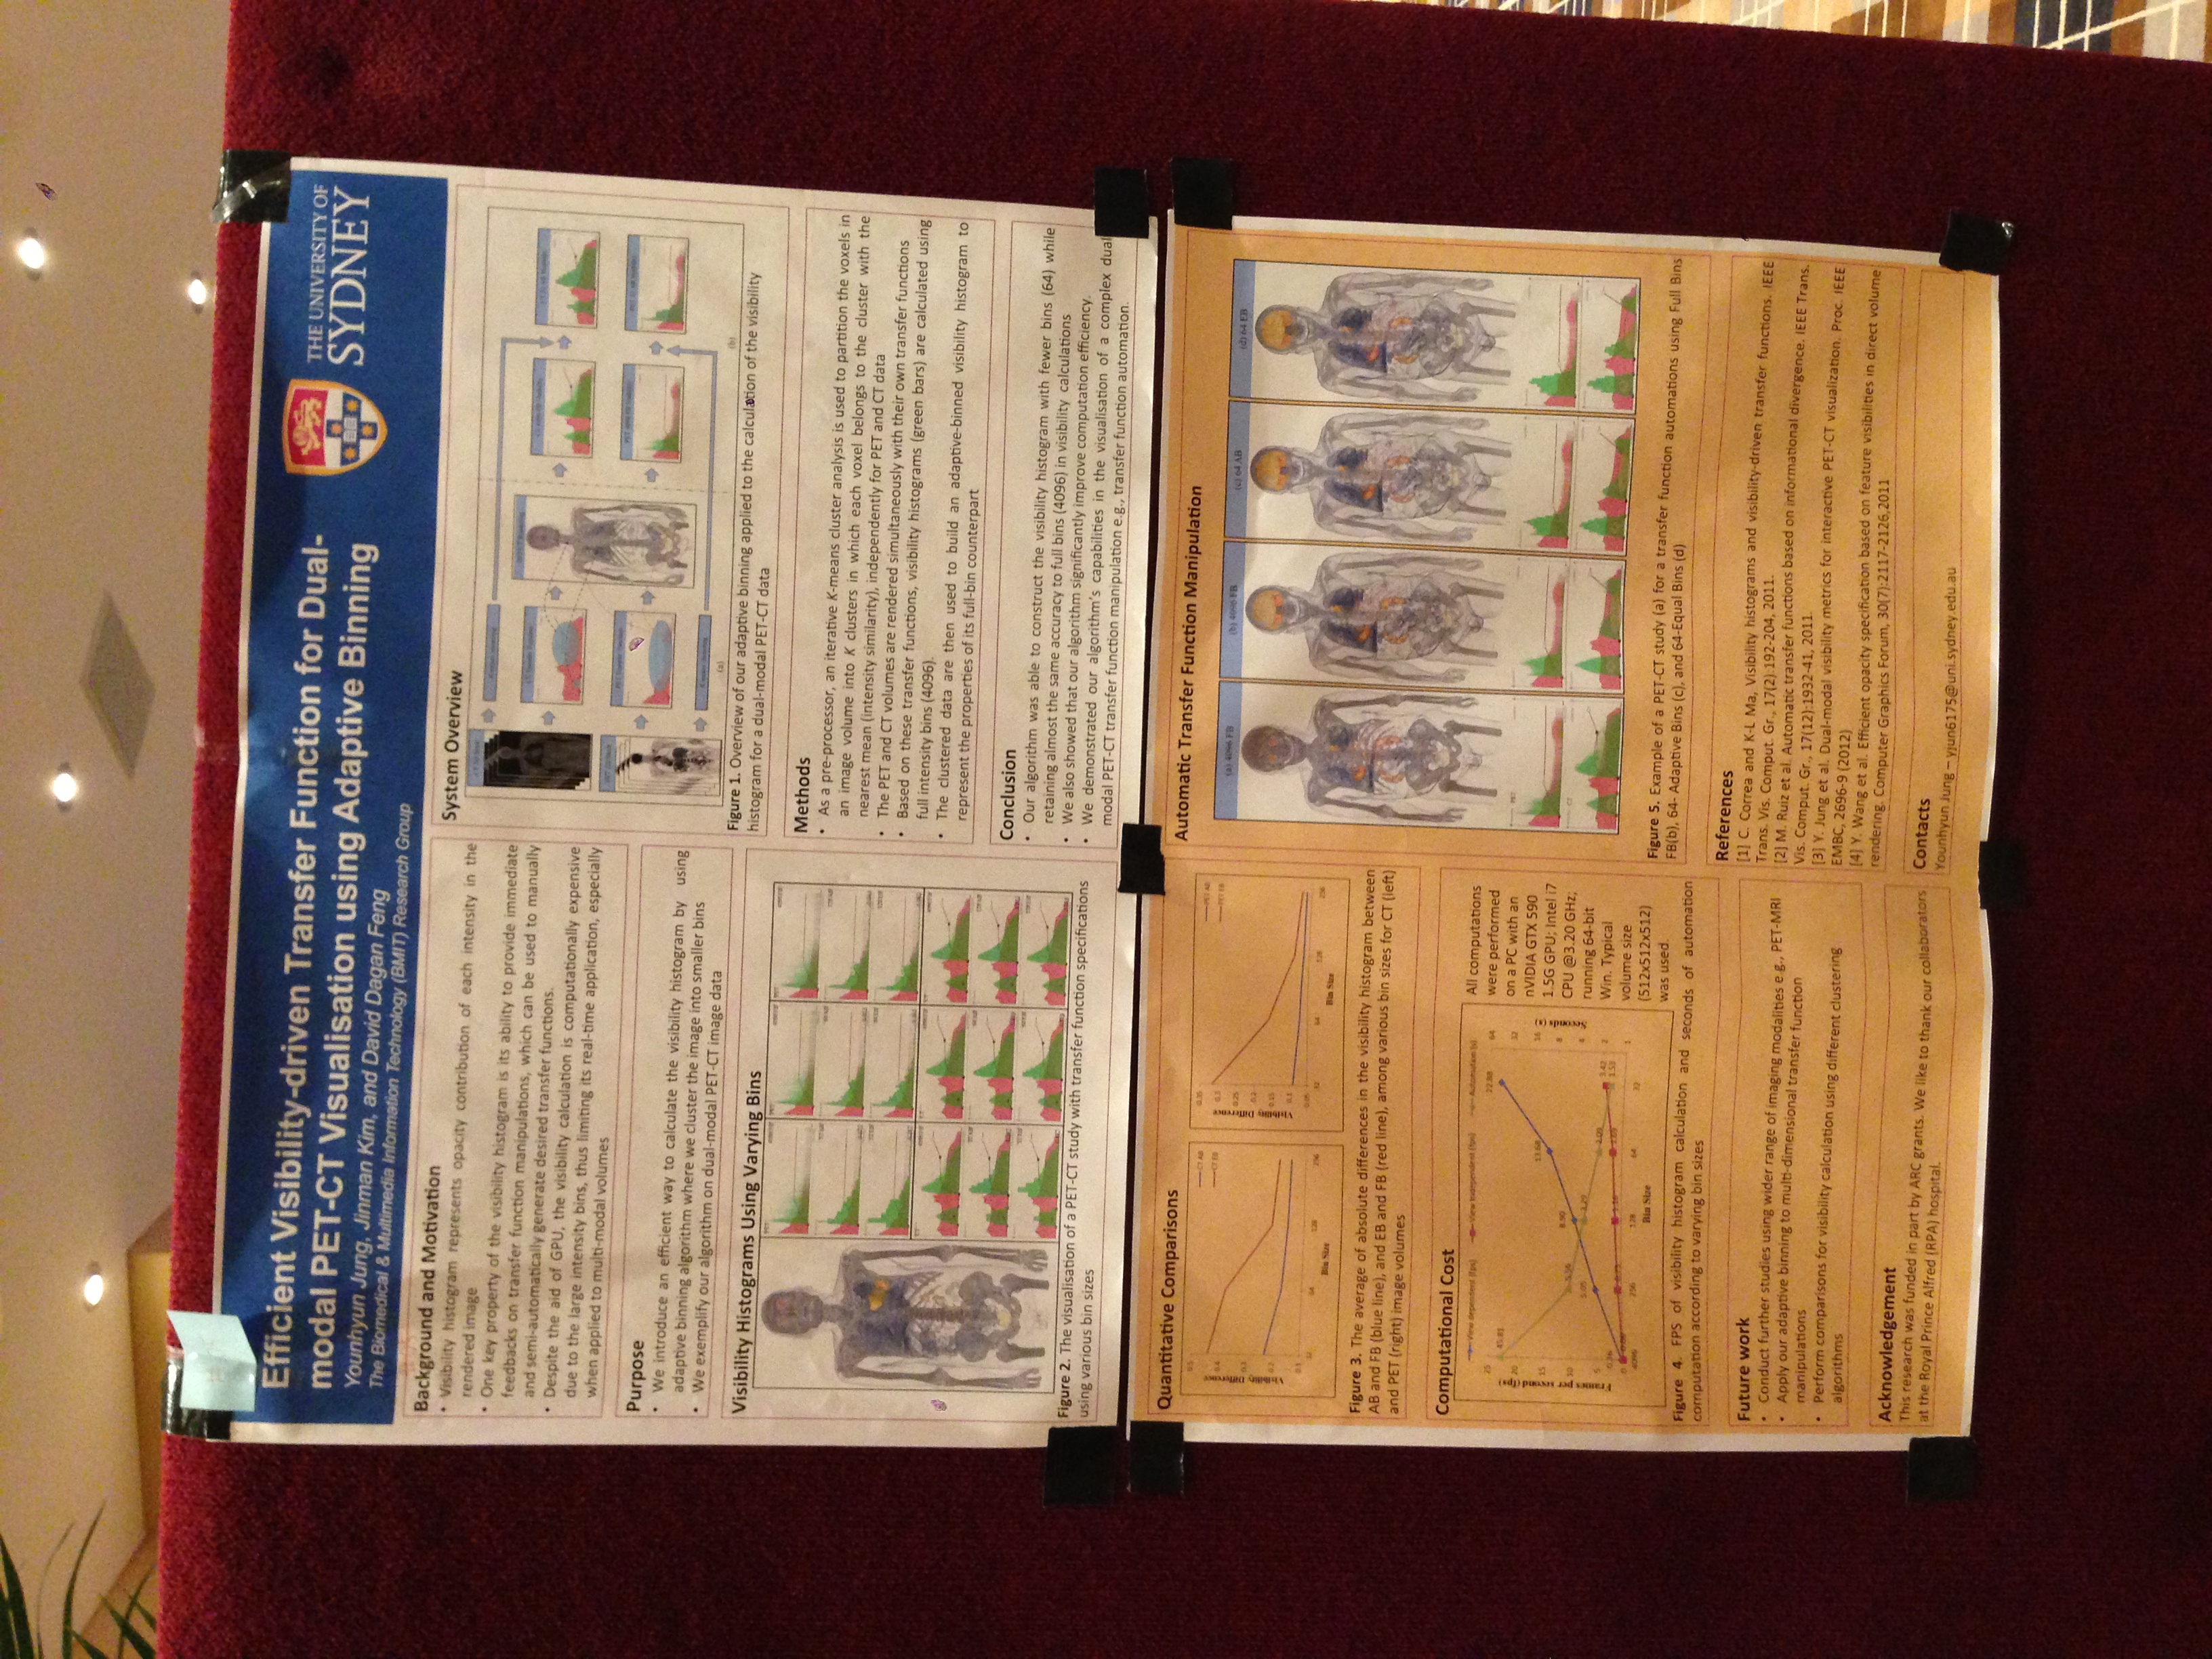
Of all the good posters that were presented at the conference, I want to highlight one with the title “Efficient Visibility-driven Transfer Function for Dual-Modal PET-CT Visualization using Adaptive Binning” by Jung et al. from the University of Sydney, Australia. They described a faster technique to calculate visibility histograms by using a binning approach on a clustered version of the scanned data.
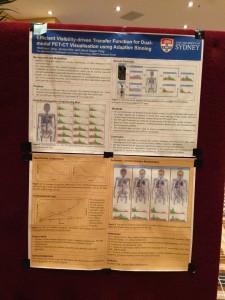
Jung et al.: “Efficient Visibility-driven Transfer Function for Dual-Modal
PET-CT Visualisation using Adaptive Binning” poster.
As this post is already far too long, and none of the remaining sessions (namely: “Time–varying and Multivariate Visualization”, “Visual Analytics”, “Tree and Graph Visualization” and “Vector and Tensor Fields Visualization” contained directly medvis research, I will wrap this one up by thanking all of the speakers and the organizers and by stating that I could unfortunately only present a small subset of all the good papers that were presented at the conference. As soon as the Proceedings are published, I hope that everybody can reach the same conclusion.
- [1] Stef van den Elzen, Danny Holten, Jorik Blaas, and Jarke J. van. Wijk: “Reordering Massive Sequence Views: Enabling Temporal and Structural Analysis of Dynamic Networks.”
- [2] Hanqi Guo and Xiaoru Yuan: “Local WYSIWYG Volume Visualization.” URL: http://vis.pku.edu.cn/research/publication/PacificVis13_ltf.pdf
- [3] Hanqi Guo, Ningyu Mao, and Xiaoru Yuan: “WYSIWYG (What You See is What You Get) Volume Visualization.” URL: http://vis.pku.edu.cn/research/publication/Vis11_wysiwyg-small.pdf
- [4] Liang Zhou and Charles Hansen: “Transfer Function Design based on User Selected Samples for Intuitive Multivariate Volume Exploration.”
- [5] A.V. Pascal Grosset, Mathias Schott, Georges-Pierre Bonneau, and Charles Hansen: “Evaluation of Depth of Field for Depth Perception in DVR.” URL: http://hal.inria.fr/docs/00/76/25/48/PDF/dofEval.pdf
- [6] Steven Martin and Han-Wei Shen: “Transformations for Volumetric Range Distribution Queries.”
- [7] Alexander Bock, Norbert Land, Gianpaolo Evangelista, Ralph Lehrke, and Timo Ropinski: “Guiding Deep Brain Stimulation Interventions by Fusing Multimodal Uncertainty Regions.” URL: http://scivis.itn.liu.se/publications/2013/BLELR13//pavis13-dbs.pdf
- [8] Erik W. Anderson, Catherine Chong, Gilbert A. Preston, and Cláudio T. Silva: “Discovering and Visualizing Patterns in EEG Data.”
- [9] Silvia Born, Michael Markl, Matthias Gutberlet, Gerik Scheuermann: “Illustrative Visualization of Cardiac and Aortic Blood Flow from 4D MRI Data.”
- [10] Silvia Born, Matthias Pfeifle, Michael Markl, Gerik Scheuermann: “Visual 4D MRI Blood Flow Analysis with Line Predicates.” URL: http://ieeexplore.ieee.org/xpl/mostRecentIssue.jsp?punumber=6178307