EuroVis 2022: Medical Visualization Highlights

(We are very thankful that Yngve Kristiansen, PhD candidate at the University of Bergen VisGroup could write this report looking forward to the medical visualization-related papers at EuroVis 2022 for us!)

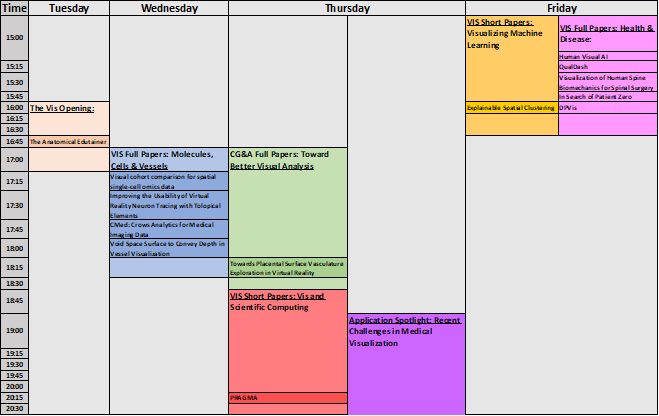
It is now the time, EuroVis is coming up and there are a lot of new exciting papers. If you are interested in medical visualization, there are many papers for you! But they are spread across different sessions, so I thought it would be nice to create a schedule for medical-relevant contributions at this year’s EuroVis! Preprints and information is available for most of the papers, but some of them were not yet published, but I still decided to put them in the schedule because I think they are definitely worth checking out!

Monday

(Paper) Toward disease diagnosis visual support bridging classic and precision medicine

Alessia Palleschi, Manuela Petti, Paolo Tieri, and Marco Angelini

Monday June 13th, EuroVA 3 : Applications – Aula Magna Room @ 14:20 – 14:45

Paper page | Video link

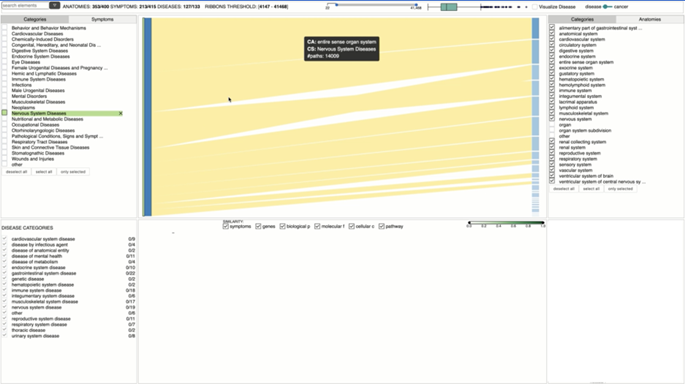
The authors present a visual analytics approach for helping medical personnel investigate symptoms, anatomies, diseases and genes during the diagnosis process. The goal of their tool is to combine the classic, often symptom-based appraoch with precision medicine — which considers more factors such as interactions between diseases, individual genes and other factors. They provide a visual analysis environment where the clinician sees a sankey diagram to compare similarities across multiple diseases.

(Paper) Physical Traces and Digital Stories: Exploring the Connections Between Forensics and Visualization

Victor Schetinger and Saminu Salisu

Monday June 13th, VisGap 1 : Domain Considerations – Sala Colonne Room A @ 15:35 – 15:55

No more information or preprint available at the time of writing.

Tuesday

(Poster) Automatic segmentation of tooth images: Optimization of multi-parameter image processing workflow

Giovani Bressan Fogalli, Daniel Baum, and Sergio Line

Tuesday June 14th, Welcome & Poster – Angelicum Garden @ 19:00

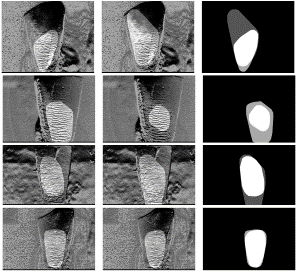
The authors propose an approach for automatically segmenting out Hunter-Schreger Bands from images of laterally illuminated teeth. They do this in the form of an image processing pipeline called anisotropy-based segmentation which they describe more closely in their poster.

(Poster) Explorative Visual Analysis of Spatio-temporal Regions to Detect Hemodynamic Biomarker Candidates

Adrian Derstroff, Simon Leistikow, Ali Nahardani, Mahyasadat Ebrahimi, Verena Hoerr, and Lars Linsen

Tuesday June 14th, Welcome & Poster – Angelicum Garden @ 19:00

No more information or preprint available at the time of writing.

(Poster) Visual Exploration of Genetic Sequence Variants in Pangenomes

Astrid van den Brandt, Eef M. Jonkheer, Dirk-Jan M. van Workum, Sandra Smit, and Anna Vilanova

Tuesday June 14th, Welcome & Poster – Angelicum Garden @ 19:00

No more information or preprint available at the time of writing.

(Poster) Accurate molecular atom selection in VR

Elena Molina Lopez and Pere-Pau Vázquez

Tuesday June 14th, Welcome & Poster – Angelicum Garden @ 19:00

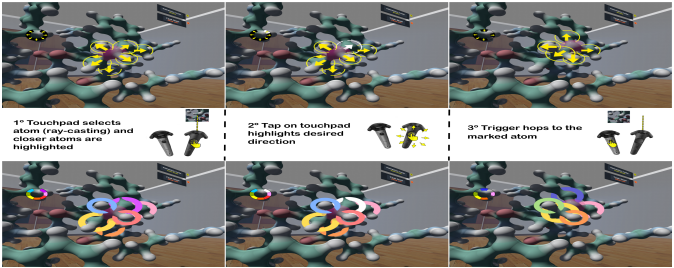
The authors present two new methods for selecting atoms in cluttered VR environments. Both methods are based on the same two following steps: (1) the user selects a single atom, (2) the system automatically highlights its neighbors, which the user can then select interactively.

Wednesday

(Paper) Barrio: Customizable Spatial Neighborhood Analysis and Comparison for Nanoscale Brain Structures

Jakob Troldi, Corrado Cali’, Eduard Gröller, Hanspeter Pfister, Markus Hadwiger, and Johanna Beyer

Wednesday June 15th, FP 5 : Life Sciences and Urbanism – Aula Minor Room @ 9:00 – 9:25

Paper page

The authors present Barrio – a configurable framework for neuroscientists to explore brain structures at a nano scale. It is configurable to several scales, so that it can be configured to answer multiple tasks and domain questions. It provides a scalable approach for comparative visualization of such spatial neighborhood relationships. They do this by providing small multiples of spatial 3D views in addition to quantitative 2D views.

(STAR) Trends & Opportunities in Visualization for Physiology: A Multiscale Overview

Laura Garrison, Ivan Kolesar, Ivan Viola, Helwig Hauser, and Stefan Bruckner

Wednesday June 15th, STAR 2 : A Journey Through Multiple Scales – Aula Minor Room @ 15:10 – 16:00

Paper page

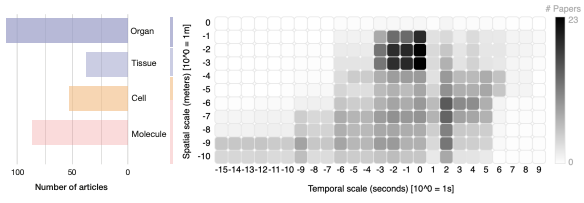
The authors summarizes trends and opportunities in visualization for physiology. They do this on two levels. On the first level, they sort literature according to organizational complexity, ranging from molecule to organ. Secondly, they classify which high-level visualization tasks (exploration, analysis, and communication) are used within an existing work.

Thursday

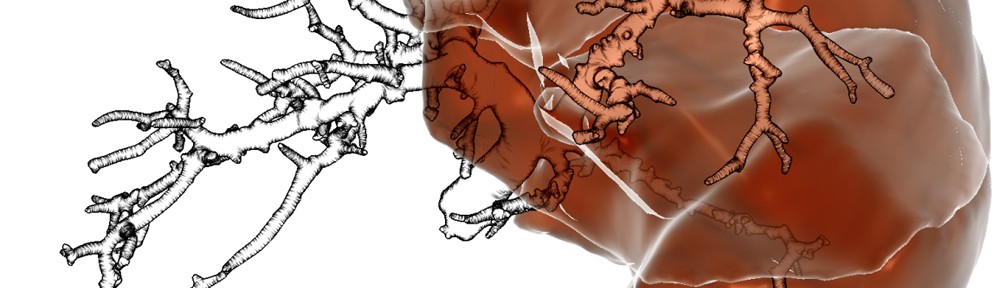
(STAR) Vessel Maps: A Survey of Map-Like Visualizations of the Cardiovascular System

Pepe Eulzer, Monique Meuschke, Gabriel Mistelbauer, and Kai Lawonn

Thursday June 18th, STAR 3 : Health and Medicine – Aula Magna Room @ 14:20 – 15:10

Paper page

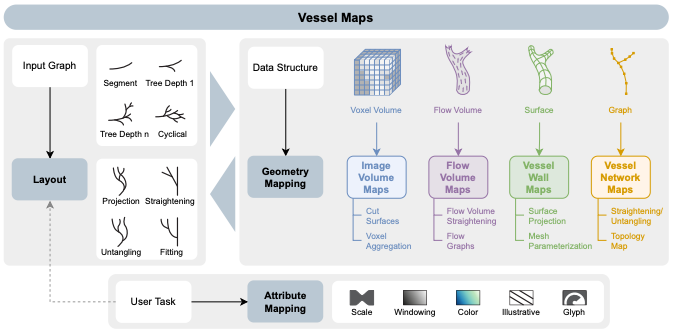
The authors make efforts to unify the vast amount of map-like visualizations of cardiovascular structures. They first provide a perspective of different data spaces from which map-like structures can be derived from. Then, they view existing approach in the light of a wide range of requirements from medical practitioners and researchers. Based on these perspectives, they offer recommendations for designing such map-like visualizations of the cardiovascular system.

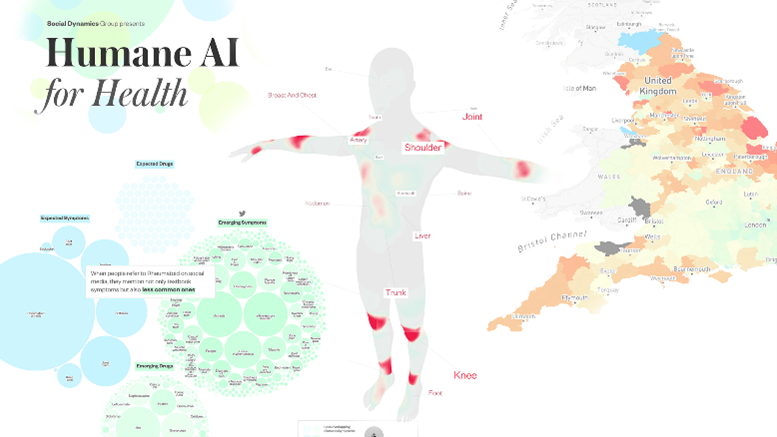
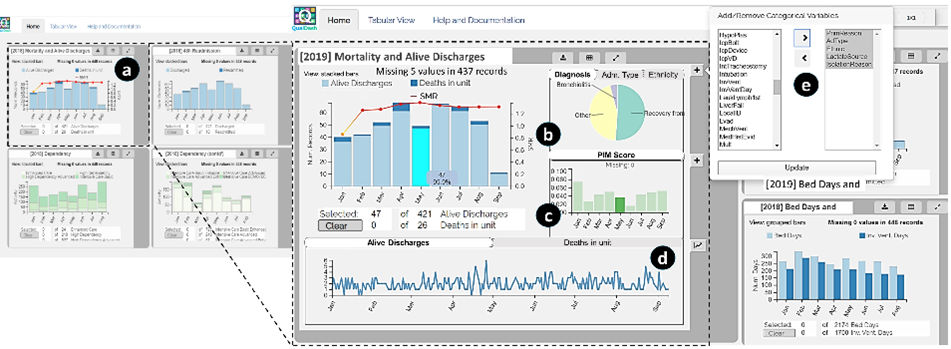
(Paper) EHR STAR: The State-Of-the-Art in Interactive EHR Visualization

Qiru Wang and Robert S. Laramee

Thursday June 18th, STAR 3 : Health and Medicine – Aula Magna Room @ 15:10– 16:00

Paper page

The authors provide the state-of-the-art for interactive electronic health record visualizations. They provide an up-to-date overview of terminology and recent research in the field of EHR. They survey 34 high quality open access healthcare data sources and datasets and 51 EHR visualization publications, and provide a classification with six re-occuring research themes and the Unified Medical Language System (UMLS).

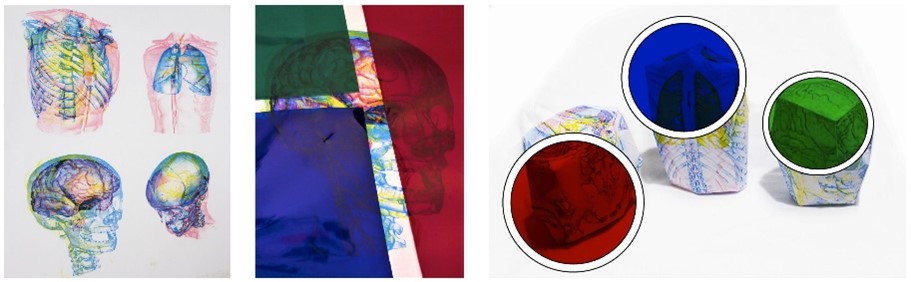
(Paper) Nested Papercrafts for Anatomical and Biological Edutainment

Marwin Schindler, Thorsten Korpitsch, Renata Georgia Raidou, and Hsiang-Yun Wu

Thursday June 16th, FP 13 : General Public – Aula Minor Room @ 15:10-15:35

Paper page

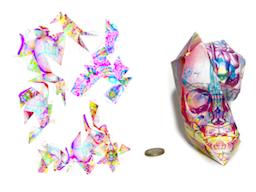
The authors present a new workflow for computer-aided generation of physicalizations, namely papercrafts, addressing nested configurations in anatomical and biological structures, seen from optimal viewpoints. Their approach aids the user by generating a paper figure version of an imported 3D model. This generated paper figure can then be printed and folded into a physicalization of the object.

Let us know if there are any papers or posters we missed in the comments!

Upcoming events and calls!

Good times all around for all things medical visualization, as there are many activities coming up! Here is a brief round-up:

  • A new online workshop series on bridging visual computing with radiation oncology is starting tomorrow with its first event! Please find more details and registration information at the webpage. The first event will be a symposium: “The symposium will feature invited thematic talks from two specialists: Uulke van der Heide (medical physics) and Noeska Smit (medical visualization), followed by a first round of discussions and interactions.”
  • If you’re working in a specialized application area within biomedical visualization or see opportunities for an underexplored area to thrive, consider submitting an Application Spotlight session proposal to IEEE VIS to draw the attention of the visualization community to this area! Check out the full call here and submit your short proposal by April 30th.
  • The first Bio+MedVis Spring School will take place virtually from May 17 to 21st. Participants can anticipate a week full of excellent talks, given by leading experts in Biological and Medical Visualization. The program is enriched by mentoring sessions, focusing on Ph.D. studies and visualization design, practical tutorials on visualization tools and libraries, and invited talks by experts from clinical practice and industry. Register for free via the official webpage by May 3rd.
  • The Karl-Heinz Höhne Award will be handed out this year again for excellent contributions in the field of medical visualization. Young scientists are invited to apply with a master thesis or publications in the context of a not yet accomplished doctoral thesis which has been published or submitted between January 2018 and May 2021. Please find out more and apply here by May 21th!
  • The EuroGraphics Workshop on Visual Computing in Biology and Medicine (VCBM) will be held in Paris and online from the 22nd to the 24th of September. They have just released their call for papers as well. Please check out the full call here and submit your papers by July 2nd.

I hope to see you at some if not all of these events 🙂 If you know of more relevant events for our community, feel free to share them in the comments section!

IEEE VIS 2020: Medical Visualization Highlights

(We are very thankful that Eric Mörth, PhD candidate at the University of Bergen VisGroup and MMIV, could write this report looking forward to the medical visualization-related papers at IEEE VIS 2020 for us!)

It is this time of the year again. The biggest visualization conference is happening again, and we are all very excited about it. This year VIS is completely virtual which comes with its challenges! For me, one positive side of it is the new VIS2020 virtual webpage. All papers are nicely presented, and it is quite easy to find the papers you are interested in. Nevertheless, I still have the feeling that I would miss something if I don’t go through all the papers and mark the papers which are about medical visualization. This year I thought instead of making a schedule of all medical visualization papers only for myself, I am sharing my schedule with you, so you can enjoy all the great works of the authors as well! I hope to see you all in the Discord channels discussing the awesome papers!

VIS Short Papers

Best Papers:

The Anatomical Edutainer

Marwin Schindler, Hsiang-Yun Wu, Renata Georgia Raidou

View paper pageView presentation: Tuesday, October 27th, 2020 @ 16:50 GMT+01:00

The authors present a workflow called Anatomical Edutainer, which enables the easy, accessible, and affordable generation of physicalizing for tangible, interactive anatomical edutainment. They use 2D printable and 3D foldable physicalizations which change their visual properties under colored lenses or colored lights.

Visualizing Machine Learning:

Explainable Spatial Clustering: Leveraging Spatial Data in Radiation Oncology

Andrew Wentzel, Guadalupe Canahuate, Lisanne van Dijk, Abdallah Mohamed, Clifton David Fuller, G. Elisabeta Marai

View paper page View presentation: Friday, October 30th, 2020 @ 16:00 GMT+01:00

The authors deliver a set of lessons learned for creating visual and explainable spatial clustering for clinical users. Their insights were gathered from multi-years collaboration with radiation oncologists and statisticians.

Vis and Scientific Computing

PRAGMA: Interactively Constructing Functional Brain Parcellations

Roza Gunes Bayrak, Nhung Hoang, Colin Blake Hansen, Catie Chang, Matthew Berger

View paper pageView presentation: Tuesday, October 27th, 2020 @ 20:20 GMT+01:00

The authors present PRAGMA, an interactive visualization method that allows domain experts to derive scan-specific parcellations from established atlases. PRAGMA features a hierarchical clustering scheme for defining temporally correlated parcels in varying granularity. The visualization supports the user in deciding on how to perform the clustering. The authors assessed the effectiveness of PRAGMA through a user study with four neuroimaging domain experts.

VIS Full Papers:

Health & Disease

Humane Visual AI: Telling the stories behind a medical condition

Wonyoung So, Edyta Paulina Bogucka, Sanja Scepanovic, Sagar Joglekar, Ke Zhou, Daniele Quercia

View paper pageView presentation: Friday, October 30th, 2020 @ 15:00 GMT+01:00

The authors mined and combined information from around half a million Reddit posts and open prescription data from the National Health Service in England to visually communicate each of the 14 selected medical condition’s biological, psychological and social aspects through storytelling. A user study with 52 participants delivered interesting insights about the effect of the visualization on them

QualDash: Adaptable Generation of Visualisation Dashboards for Healthcare Quality Improvement

Mai Elshehaly, Rebecca Randell, Matthew Brehmer, Lynn McVey, Natasha Alvarado, Chris P. Gale, Roy Ruddle

View paper pageView presentation: Friday, October 30th, 2020 @ 15:15 GMT+01:00

The authors present a task analysis that resulted in a metric card metaphor as a unit of visual analysis in healthcare quality improvement. They are using the concept as a building block for generating highly adaptive dashboards and leading to the design of a metric specification structure. QualDash has been deployed in cardiology wards and pediatric intensive care units in five NHS hospitals and the authors report on evaluation results of the usage in a real-world scenario.

Visualization of Human Spine Biomechanics for Spinal Surgery

Pepe Eulzer, Sabine Bauer, Francis Kilian, Kai Lawonn

View paper pageView presentation: Friday, October 30th, 2020 @ 15:30 GMT+01:00

The authors present a visualization application, designed for the exploration of human spine simulation data. The link simulation outcomes with patient-specific anatomy, to make relevant parameters graspable for clinicians, by introducing new concepts to show the directions of impact force vectors. The authors evaluated their application with both surgeons and biomechanical researchers.

In Search of Patient Zero: Visual Analytics of Pathogen Transmission Pathways in Hospitals

Tom Baumgartl, Markus Petzold, Marcel Wunderlich, Markus Höhn, Daniel Archambault, Michael Lieser, Alexander Dalpke, Simone Scheithauer, Michael Marschollek, Vanessa Eichel, Nico T. Mutters, Tatiana von Landesberger

View paper page View presentation: Friday, October 30th, 2020 @ 15:45 GMT+01:00

The authors present a novel visual analytics approach to support the analysis of transmission pathways, patient contacts, the progression of the outbreak, and patient timelines during hospitalization. In a final study, feedback from twenty-five experts from seven German hospitals provided evidence that their solution brings significant benefits for analyzing pathogen outbreaks.

DPVis: Visual Analytics with Hidden Markov Models for Disease Progression Pathways

Bum Chul Kwon, Vibha Anand, Kristen A Severson, Soumya Ghosh, Zhaonan Sun, Brigitte I Frohnert, Markus Lundgren, Kenney Ng

View paper pageView presentation: Friday, October 30th, 2020 @ 16:00 GMT+01:00

The authors introduce DPVis to integrate model parameters and outcomes of Hidden Markov Models into an interpretable and interactive visualization. The authors state that their tool is successful in evaluating disease progression models, visually summarizing disease states, interactively exploring disease progression patterns, and building, analyzing, and comparing clinically relevant patient subgroups.

Molecules, Cells & Vessels

Visual cohort comparison for spatial single-cell omics-data

Antonios Somarakis, Marieke Ijsselsteijn, Sietse Luk, Boyd Kenkhuis, Noel de Miranda, Boudewijn Lelieveldt, Thomas Höllt

View paper pageView presentation: Wednesday, October 28th, 2020 @ 17:15 GMT+01:00

The authors present an interactive visual analysis workflow for the comparison of cohorts of spatially resolved omics-data. They allow for a comparative analysis of two cohorts based on multiple levels-of-details. The application enables the identification of cohort-differentiating features and outlier samples at any stage of the workflow. The authors conducted multiple case studies with domain experts from different application areas and with different data modalities, to show the effectiveness of the workflow.

Improving the Usability of Virtual Reality Neuron Tracing with Topological Elements

Torin McDonald, Will Usher, Nate Morrical, Attila Gyulassy, Steve Petruzza, Frederick Federer, Alessandra Angelucci, Valerio Pascucci

View paper page View presentation: Wednesday, October 28th, 2020 @ 17:30 GMT+01:00

The authors propose a new semi-automatic method to guide users in tracing neurons by using topological features. The use of a virtual reality framework which has been used for manual tracing before. In a pilot study, neuroscientists demonstrated a strong preference for their tool over prior approaches. The approach delivered an increased tracing speed while retaining a similar accuracy compared to a fully manual approach.

CMed: Crowd Analytics for Medical Imaging Data

Ji Hwan Park, Saad Nadeem, Saeed Boorboor, Joseph Marino, Arie Kaufman

View paper pageView presentation: Wednesday, October 28th, 2020 @ 17:45 GMT+01:00

The authors present CMed, a visual analytics framework for the exploration of medical image data annotations, acquired from crowdsourcing. They evaluated the efficacy of the framework with two medical crowdsourcing studies and provide expert’s feedback to show the effectiveness of CMed.

Void Space Surfaces to Convey Depth in Vessel Visualizations

Julian Kreiser, Pedro Hermosilla, Timo Ropinski

View paper pageView presentation: Wednesday, October 28th, 2020 @ 18:00 GMT+01:00

The authors propose Void Space Surfaces, a technique that utilizes the empty space in between vessel branches to communicate the depth and their relative positioning. It allows them to improve the depth perception of the vascular structures without interference with the spatial data. Furthermore, the authors deliver two user studies to evaluate the perceptual impact of Void Space Surfaces.

CG&A Full Papers

Towards Better Visual Analysis

Towards Placental Surface Vasculature Exploration in Virtual Reality

Johannes Novotny, Wesley R. Miller, François I. Luks, Derek Merck, Scott Collins, David H. Laidlaw

View paper pageView presentation: Thursday, October 29th, 2020 @ 18:15 GMT+01:00

The authors present a case study where they evaluation the application of virtual reality environments to identify placental surface blood vessels. They observed that the visualization is easy to understand and allows for intuitive exploration, but complex user interactions remained a challenge.

Schedule:

Please note that this schedule is in CET time! You can find the general schedule in your timezone at https://virtual.ieeevis.org/calendar.html

I am looking forward to a successful virtual version of our biggest and most impactful conference, VIS. I hope to see you in one of the Discord channels to discuss all the mentioned papers and to get the feeling of being a part of this year’s VIS conference. Let us hope that future conferences will be in person again to enjoy the experience even more!

See you at VIS2020 😊

Karl Heinz Höhne awarded with the Enduring Impact Award at MICCAI 2020

Bernhard Preim just sent us a tip that Karl Heinz Höhne has been awarded with the enduring Impact Award at MICCAI 2020, which is great news for medical visualization! Professor Höhne is well known for his work on the 3D anatomy visualization platform VOXEL-MAN as well as his pioneering work on medical image volume rendering (see also: Groundbreaking volume rendering papers by Professor Karl Heinz Höhne: a medvis.org exclusive!)

We congratulate prof. Höhne with this well-deserved award!

IEEE VIS 2020: virtual + free for attendees!

Following the footsteps of EG EuroVis 2020 and EG VCBM 2020, IEEE VIS will also be fully virtual and free for attendees and held 25-30 October 2020. The preliminary program is available here. While we can always expect several medical visualization paper and in some years even dedicated biomedical visualization sessions, there are already several talks and events announced to look forward to:

Hope to see some of you at virtual IEEE VIS this year! Don’t forget to register here! Have you spotted other medvis-related content to look forward to? Please mention it in the comments!

VCBM: virtual and free this year + call for image contest submissions!

The premier workshop venue for biomedical visualization research VCBM is already celebrating it’s 10th anniversary this year! We are happy to share the following information from the chairs:

“10th Eurographics Workshop on Visual Computing for Biology and Medicine (EG VCBM 2020) September 28 – October 1, 2020 (virtual workshop)

As VCBM is held virtually this year due to COVID-19, the registration is free for all participants (visit www.vcbm.org to register). This year, VCBM is held jointly with VMV (the 25th International Symposium on Vision, Modeling and Visualization) and DAGM GCPR (the 42nd German Conference on Pattern Recognition). All talks will be live-streamed and there will be ample opportunities for discussions and scientific exchange.

For the 10th anniversary of EG VCBM, we are happy to announce an exciting program with high-profile keynote speakers, research paper presentations, industry talks, a joint panel discussion together with VMV, a free half-day tutorial on game engines for visualization on Monday, posters, and an image contest. For the latter, we would like to invite you to submit your images related to computational biology and medicine – visualizations, photorealistic and non-photorealistic renderings, computer generated and hand-drawn illustrations are all welcome. A jury will select the best submission to receive the VCBM Image Award, and the conference participants will select the People’s Choice Award. All the accepted submissions will be displayed in a virtual gallery on the VCBM webpage. The deadline for the submission is September 20, 2020. For more information and submission instructions, please visit: https://www.gcpr-vmv-vcbm-2020.uni-tuebingen.de/?page_id=612

We are also happy to announce that there will be again an open call for submissions to the Computers and Graphics Journal (C&G) Special Section on Visual Computing for Biology and Medicine (VCBM) after the workshop. Besidesoriginal research, system, and survey papersthat summarize and expand the state of the art in visual computing with a strong focus on applications to biology and medicine, we explicitly want to invite significantly extended and revised versions of full papers, surveys, or posters presented at the VCBM 2020 (full papers are expected to contain at least 30% of additional material).

We hope to see you all at virtual DAGM GCPR | VMV | VCBM 2020! For more information, see www.vcbm.org!

the General Chairs of VCBM 2020:
Michael Krone (University of Tübingen, Germany)
and Kay Nieselt (University of Tübingen, Germany)”

EuroRVVV 2017 Call for papers: Extended deadline!

EuroRVVV (the international EuroVis Workshop on Reproducibility, Verification, and Validation in Visualization) will be held for the fifth time this year, and this edition is focused on “Perception in Visualization”. This topic is also quite fitting for medical visualization research, and the deadline was recently extended to February 27th, so there is still time to submit your medical visualization-themed papers! See the full call for papers here!

At the workshop, which is co-located with EuroVis, there will also be an interesting keynote by Prof. Dr. Douglas W. Cunningham, chair of the Graphic Systems Department at BTU Cottbus-Senftenberg, entitled ‘Modifying Perceptual Experiments to Evaluate Visualization Techniques’. We look forward to receiving your submissions, and hope to see you in Barcelona!

Further details and submission details can be found at: http://eurorvvv.org

Report: ‘Information Theory in Visualization’ Tutorial at Eurographics 2016

About two weeks ago, I was lucky enough to be able to attend Eurographics for the first (hopefully not the last!) time. While in general, there are more graphics than visualization topics presented, there was one tutorial that was highly relevant to my medical visualization interests, and potentially also yours. On the 10th of May, there was an amazing tutorial on Information Theory in Visualization. I will provide a short summary of what went down there: Continue reading

Kai Lawonn wins the Eurographics PhD award 2016!

I’m reporting live from Eurographics 2016 in Lisbon, Portugal and I have got some exciting news for you! Since 2011, every year the Eurographics association awards the Best PhD Thesis Award to the theses with the highest quality and impact. The awarded researchers so far were mainly specialized in computer graphics and geometric modeling. Until now, that is, since this year, one of these highly prestigious award goes to…. Continue reading