Here’s one for the ‘better late than never’-category: my EuroVis 2012 summary! I’ve kept my eye out for interesting medvis talks and will briefly summarize the ones I have seen here.
- The first talk in this session was entitled ‘Reliable Adaptive Modelling of Vascular Structures with Non-Circular Cross-Sections‘ and given by Jan Kretschmer from Germany. He described RAMVAS, an interesting method to generate surface representations for vascular systems. Their approach reliably reconstructs vessels independent of their thickness based on free-form contours and radial cross-sections using scale-adaptive meshes.
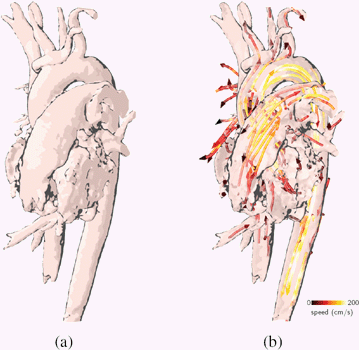
- The second talk was given by Roy van Pelt from the Netherlands: ‘Visualization of 4D Blood-Flow Fields by Spatiotemporal Hierarchical Clustering‘. Using hierarchical clustering, level-of-detail can be selected intuitively while the important flow patterns are still visible. Performance of the algorithm was improved by introducing a coarse hierarchical clustering approach. The flow clusters were visualized using patharrows combined with illustrative anatomical context.
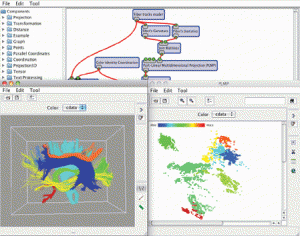
- The third talk of the session was entitled ‘Employing 2D projections for fast visual exploration of large fiber tracking data‘ and presented by Rosane Minghim. By using the LAMP projecting technique for feature extraction, users are able to select fiber bundles in feature space.
- The last talk of the session, ‘Biopsy Planner – Visual Analysis for Needle Pathway Planning in Deep Seated Brain Tumor Biopsy‘, was given by Paul-Corneliu Herghelegiu. Their approach provides a way of planning a biopsy pathway for deep seated brain tumors, while avoiding vessels. Using a tumor and cerebral vasculature segmentation from a CT scan, a region of interest can be painted on the skin. An entry point stability map is then calculated, by projecting the painted region onto the saggital plane. The distance from needle to vessels is then shown to the user as a graph.


