(We are grateful and overjoyed that Renata Raidou, of the TU Eindhoven University (the Netherlands) could write this short report on the medical visualization-related papers and other highlights at EuroVis 2013 for us.)
This year the EuroVis conference was held in Leipzig, Germany from June 17-21. It was organized by the Image and Signal Processing group of the University of Leipzig in collaboration with the Visualization Group of the University of Magdeburg. This conference was dedicated to the late Dirk Bartz, a former member of the EuroVis Steering Committee, who promoted this conference in Leipzig for many years.
The conference had a really busy program, with five workshops (EuroVA: Workshop on Visual Analytics, EuroRV: Workshop on Reproducibility, Verification, Validataion and Visualization, VMLS: Workshop on Visualization in Medicine and Life Sciences, EnvirVis: Workshop on Visualization in Eniromental Science, VAMP: Workshop on Visual Analytics using Multi-dimensional Projections). They were held in parallel sessions and featured 13 invited talks and 47 contributions of researchers working on visualization around the world. Just to mention few of the remarkable invited talks in the workshops:
- in EuroVA, Silvia Miksch gave a keynote presentation on Visual Analytics for Time-Oriented Data and Information;
- in EuroRV, Torsten Möller gave a talk on the Evaluation of Visualization in Science and in Design, Gordon Kindlmann gave a captivating capstone presentation on Reproducibility in Visualization;
- in VMLS, there were five inspiring invited talks by Horst Hahn, Timo Ropinski, Thomas Schultz, Bernhard Preim and Alexander Wiebel;
- in EnvirVis, the keynote was given by Joerg Meyer on the challenges in the visualization of environmental data;
- in VAMP, an interesting talk was given by Tamara Munzner on current research that tries to solve the problem of dimensionality reduction in visualization from different methodological angles of attack.
The official opening of the main conference included a keynote presentation by Peter F. Stadler on “Bio-informatics of non-coding RNA”, followed by a fast forward to all conference presentations, where everyone could advertise their work. The main conference included 49 full papers and 18 short papers, but I will focus on the three talks from the Medical Visualization part, plus a “bonus” talk from the “Volumes” category, also related to medical applications.
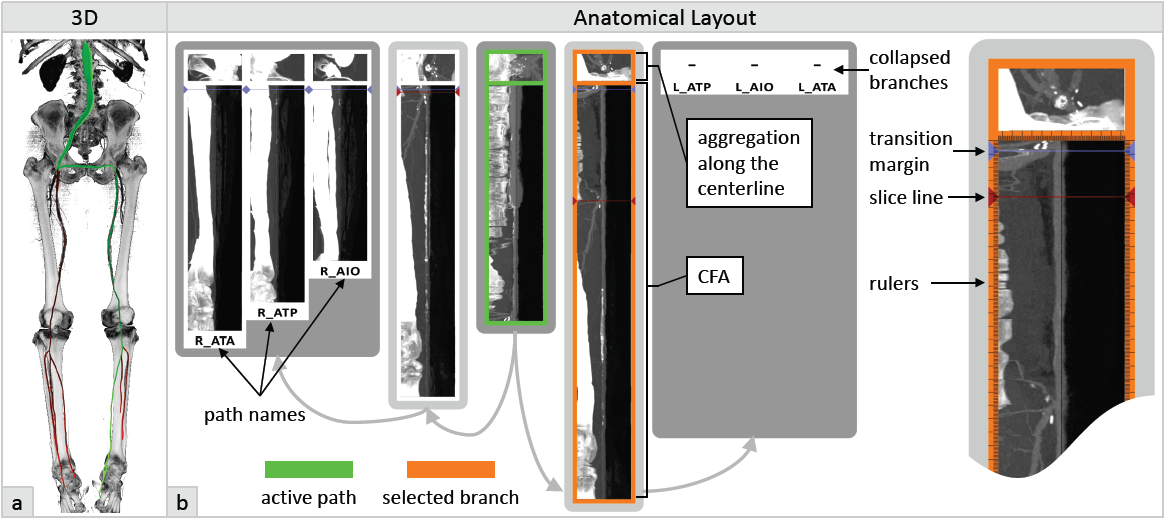
The first talk was given by Gabriel Mistelbauer from Vienna University of Technology on “Vessel Visualization using Curvicircular Feature Aggregation”. He described Curvicircular Feature Aggregation (CFA), a new technique for the visualization of blood vessels, which aggregates the images acquired around the centerline using conventional Curved Planar Reformation (CPR) into a single static image. In this way, the rotation of these images is eliminated and vessels can be investigated by inspecting only one image.
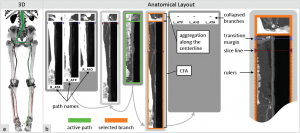
Vessel Visualization using Curvicircular Feature Aggregation – G. Mistelbauer
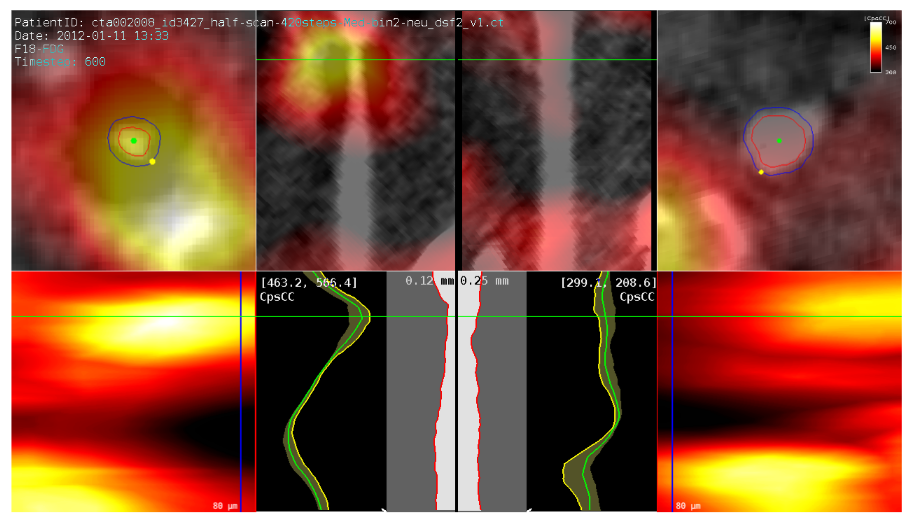
The second talk was given by Stefan Diepenbrock from the Visualization and Computer Graphics Research Group, University of Münster on “Comparative Visualization of Tracer Uptake in In Vivo Small Animal PET/CT Imaging of the Carotid Arteries”. He described a visualization application which enables the medical expert to explore and analyze in-vivo PET activity around vessels, through a projection technique that renders data around the vessels in a single image. In this way, the user can quickly check for activity maxima, intensity and spread.

Comparative Visualization of Tracer Uptake in In Vivo Small Animal PET/CT Imaging of the Carotid Arteries – S. Diepenbrock
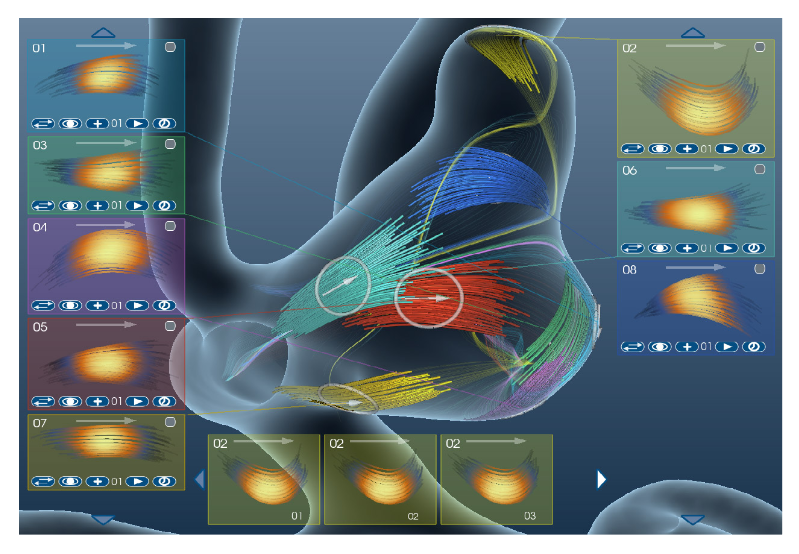
The third talk was given by Mathias Neugebauer from the Visualization Group of Magdeburg University on “AmniVis – A System for Qualitative Exploration of Near-Wall Hemodynamics in Cerebral Aneurysms”. He described an approach for the selection of surface regions of interest and for 2D overview of flow patterns represented by streamlines at these regions. The AmniVis supports binary classification of patterns and temporal exploration as well as methods for selection, highlighting and automatic 3D navigation to particular patterns.

AmniVis – A System for Qualitative Exploration of Near-Wall Hemodynamics in Cerebral Aneurysms – M. Neugebauer
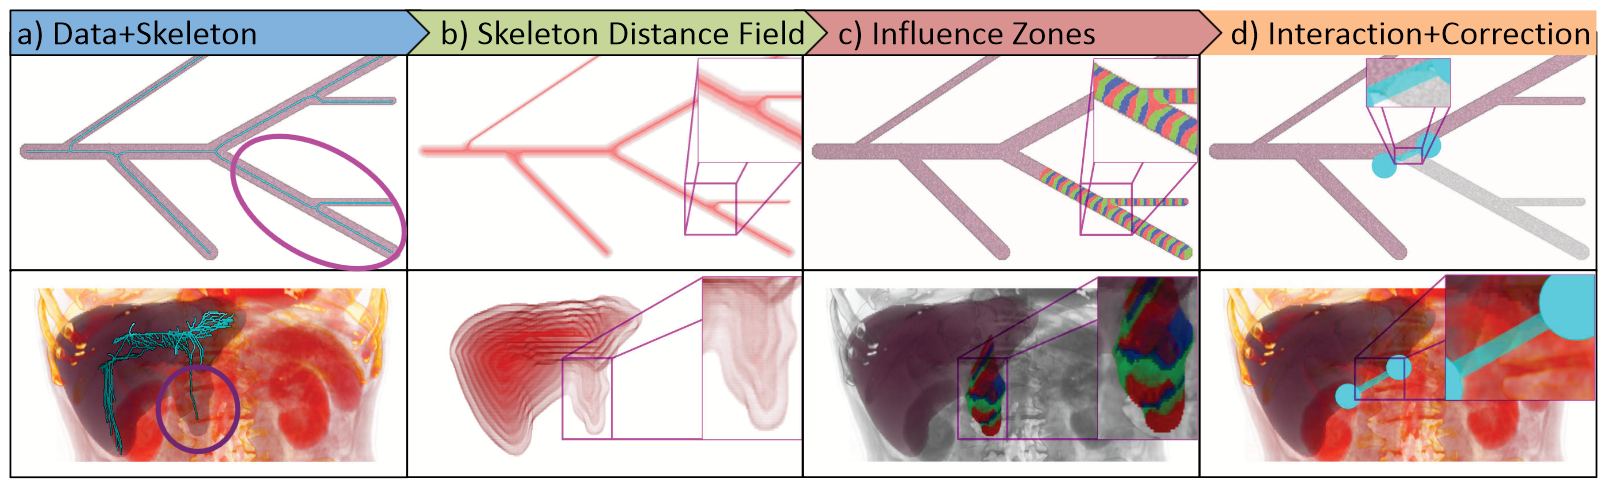
The last talk was given by Alexey Karimov from Vienna University of Technology on “ViviSection: Skeleton-based Volume Editing”. He described a novel approach for the editing of segmentation results that exploits structural features of the segmented object for correction and verification. In cases of severe pathologies, this new approach can increase the segmentation quality.
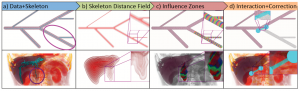
ViviSection: Skeleton-based Volume Editing – A. Karimov
The conference was concluded on Friday 21 June by a captivating capstone by Hans Christian Hege on “Visualization in the Neuroscience Era: The Road Ahead” with a promising observation that in the coming years neuroscience and visualization will move towards each other with great and mutual benefit.
The Best Paper Award was given to Sharon Lin et al. for the paper “Selecting Semantically-Resonant Colors for Data Visualization”, while the Best Short Paper Award was given to Alice Thudt et al. for “Visits: A Spatiotemporal Visualization of Location Histories”. Two more papers (“Vector Field k-Means: Clustering Trajectories by Fitting Multiple Vector Fields” by Nivan Ferreira et al. and “Maximum Entropy Summary Trees” by Howard Karloff and Kenneth E. Shirley) also received Honorable Mentions.
I really enjoyed attending this conference. It was my first time at EuroVis and I had the opportunity to meet a lot of amazing people and listen to a very interesting and inspiring talks. Next year, EuroVis2014 will be held in Swansea, South Wales, UK from June the 9th until June the 13th, so put these dates on your agenda!