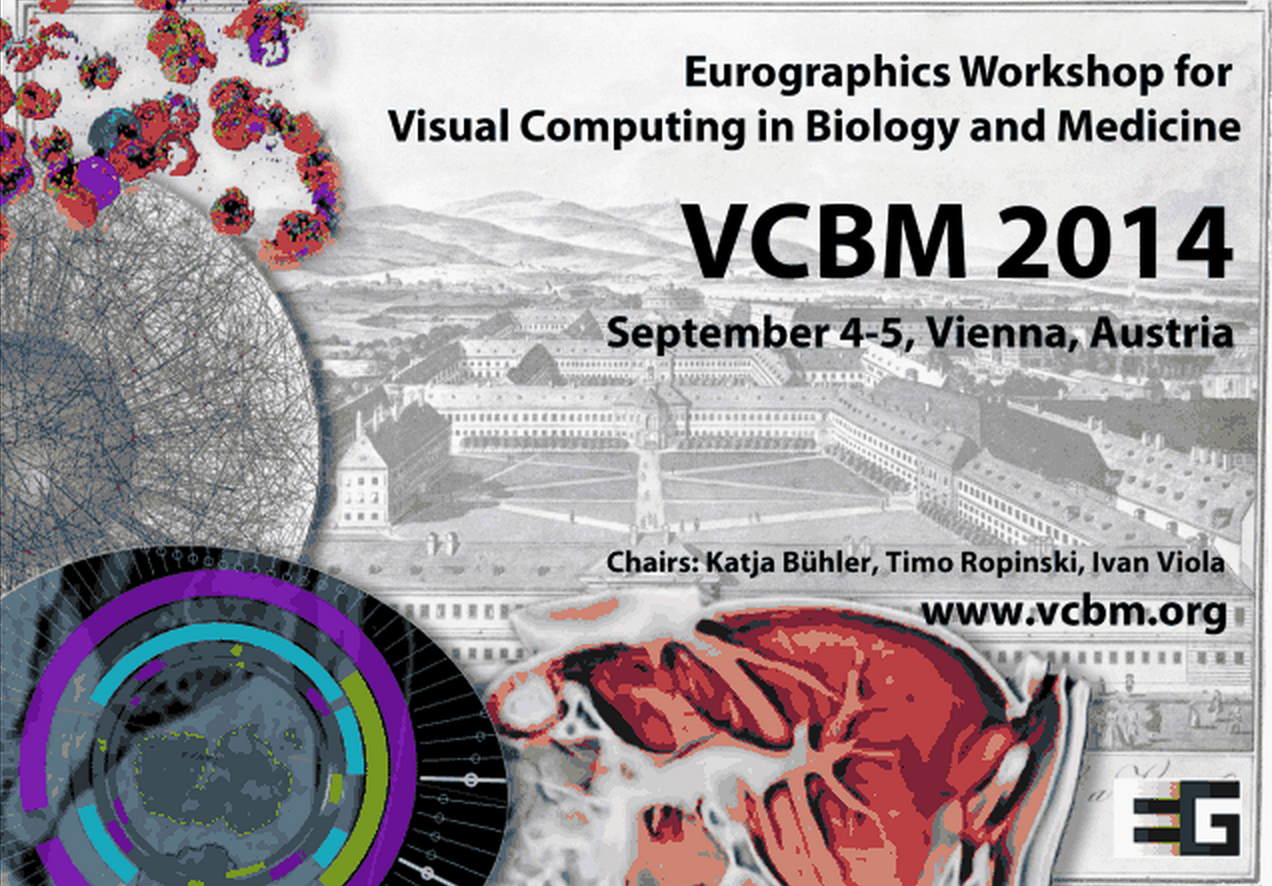
In the spirit of better late than never, the Eurographics Workshop on Visual Computing for Biology and Medicine (VCBM) 2014 conference report, summarizing some personal highlights. At VCBM 2014, we tweeted a picture for every talk and then some, which was arguably a bit much, but still a lot of fun. The VCBM organization also posted a great recap using Storify at their website. Given the theme of the conference, almost every talk is relevant to our medical visualization interests, but I would like to briefly summarize only a couple of them here. The benefit of delaying so long in writing this is that there are a lot of videos online by now. I will try to let the videos speak a 1000 words where available instead of getting too verbose. Onwards to the highlights!
The venue was really amazing, VCBM was held in the Universitätscampus
Altes AKH, but not just in any old lecture hall, it was the former anatomical theatre of the AKH and still has the original marble slab that was used as a dissection table:

Hörsaal D at the AKH
A day before the start of VCBM itself, the VCBM fachgruppe (working group) had a meeting with six interesting talks. This was followed by a social event, a guided tour of the Narrenturm. Built in 1874 to treat mental patients, it now serves as a museum for the Pathologic-Anatomical Collection. The Narrenturm features a huge collection of moulages. These are wax models of diseases made based on real patients and used in medical education, which is cool and slightly creepy at the same time. This tour was followed up by a delicious dinner at Unibräu for those who didn’t lose their appetite after what they had seen during the tour.
On Thursday, VCBM itself kicked off with an opening by Katja Bühler. After this we enjoyed a keynote by Anna Vilanova on the future of medical visualization. Anna presented medical visualization as a field that is between fields: computer graphics and medical imaging. She talked us through the past, present and future of medvis and going from facilitating analysis of the known to unraveling the unknown using visualization. A memorable quote from her talk:
“If the brain were so simple that we could understand it, we would be so simple we couldn’t” – Lyall Watson
Thursday featured four interesting sessions on Multivariate Data Analysis, Segmentation and Uncertainty, Microscopy and Visual Analytics for Biology:
- Multivariate Data Analysis:
- Benjamin Köhler presented interesting work on “Robust Cardiac Function Assessment in 4D
PC-MRI Data” [1]. Four-dimensional phase-contrast magnetic resonance imaging (4D PC-MRI) is a relatively new modality that can acquire non-invasive, time-resolved, three-dimensional blood flow information. Benjamin proposed robust quantification techniques to assess cardiac function in this data. - I am obviously biased because she is from my group ;), but Renata Raidou presented her work entitled “The iCoCooN: Integration of Cobweb Charts
with Parallel Coordinates for Visual Analysis of
DCE-MRI Modeling Variations” [2]. She proposed a visualization application for the exploration and analysis of model-induced
variations in pharmacokinetic parameters. For this application, she created a visual representation, the Cocoon, by integrating perpendicularly Parallel Coordinate Plots (PCPs) with Cobweb Charts (CCs). A demo video is available here.
- Benjamin Köhler presented interesting work on “Robust Cardiac Function Assessment in 4D
- Segmentation and Uncertainty:
- Peter Faltin presented his work on “Extracting and Visualizing Uncertainties in
Segmentations from 3D Medical Data” [3]. He introduces a new processing chain comprising a series of carefully selected and well-matched steps to
determine and visualize a segmentation boundary. Additionally, a novel visualization method was presented, specifically designed to simultaneously provide information about 3D morphology, confidence and possible errors.
- Peter Faltin presented his work on “Extracting and Visualizing Uncertainties in
- Microscopy:
- Steffen Oeltze-Jafra delivered an excellent talk on “Interactive Labeling of Toponome Data” [4]. In this work, they present an approach for the in-place annotation of multi-channel microscopy data in 2D views, combining dynamic excentric labeling and static necklace maps:
- Visual Analytics for Biology:
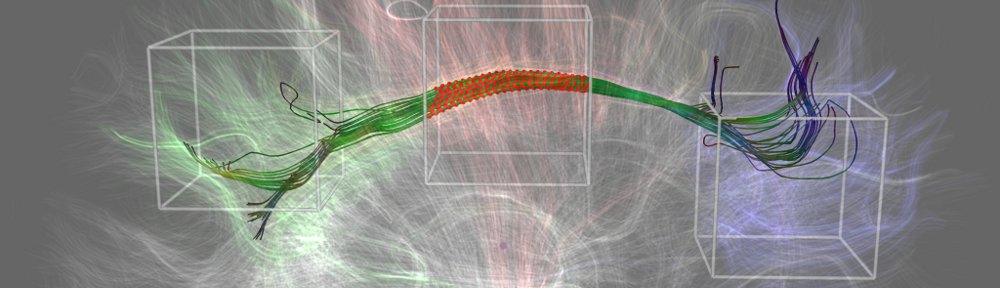
- I really enjoyed the talk by Nicolas Swoboda on “Visual and Quantitative Analysis of Higher Order Arborization Overlaps for Neural Circuit Research” [5]. The overlaps they are reffering to, consist of two or more neurons and indicate a potential anatomical connection. They present a novel tool for potential connectivity exploration by providing for the first time the possibility to compute and visualize higher order arborization overlaps on the fly (for fruit fly brains, well played!) and to interactively explore this information in its spatial
anatomical context and on a quantitative level. Slides of the talk are available here and this is the accompanying video:
- I really enjoyed the talk by Nicolas Swoboda on “Visual and Quantitative Analysis of Higher Order Arborization Overlaps for Neural Circuit Research” [5]. The overlaps they are reffering to, consist of two or more neurons and indicate a potential anatomical connection. They present a novel tool for potential connectivity exploration by providing for the first time the possibility to compute and visualize higher order arborization overlaps on the fly (for fruit fly brains, well played!) and to interactively explore this information in its spatial
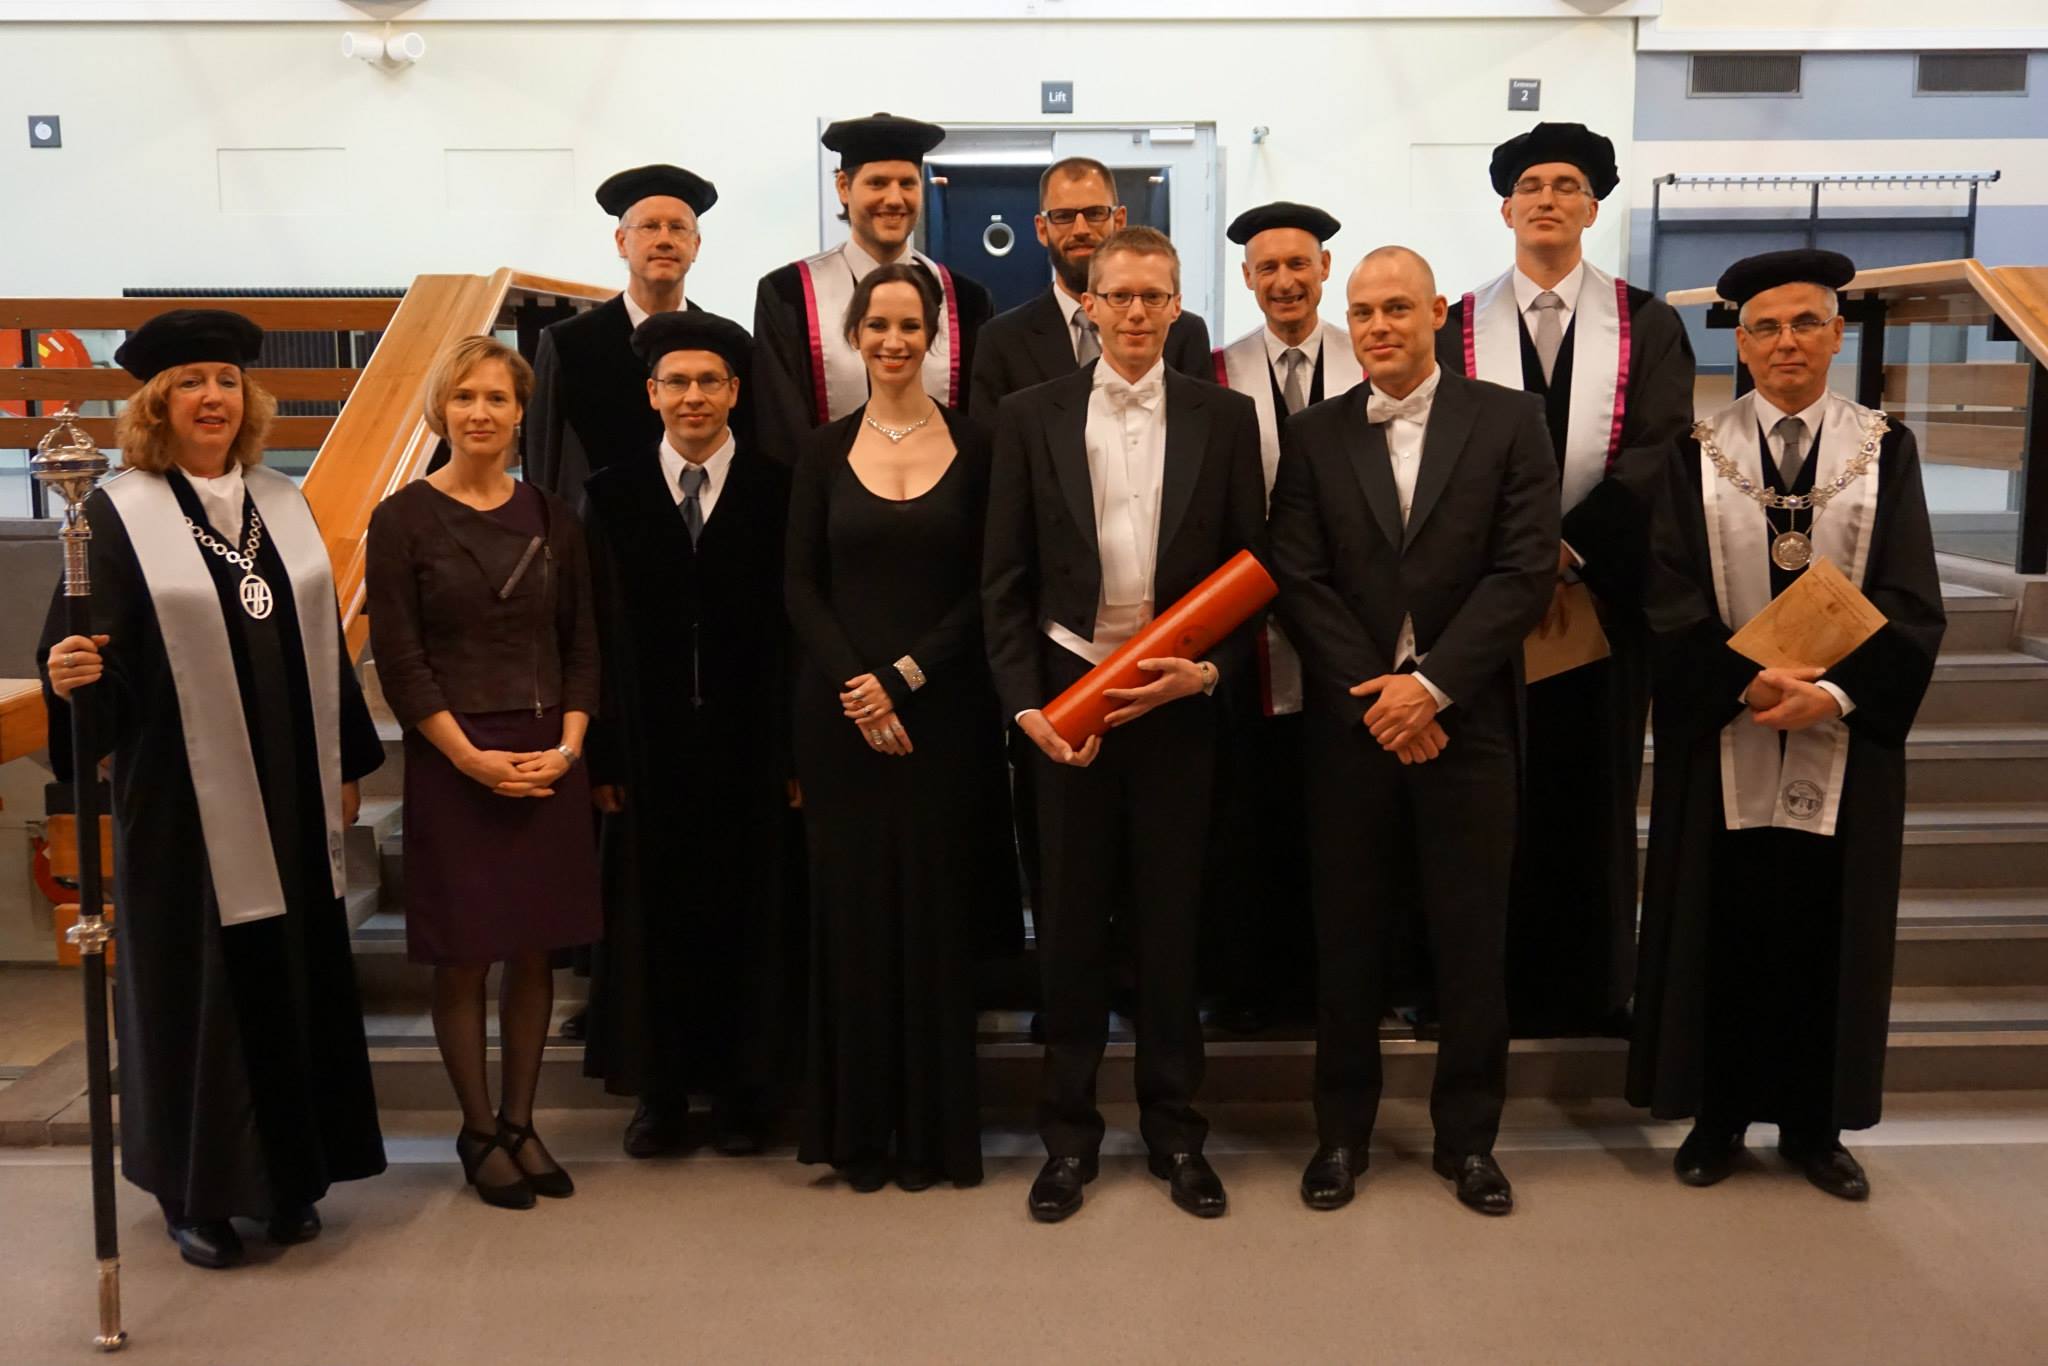
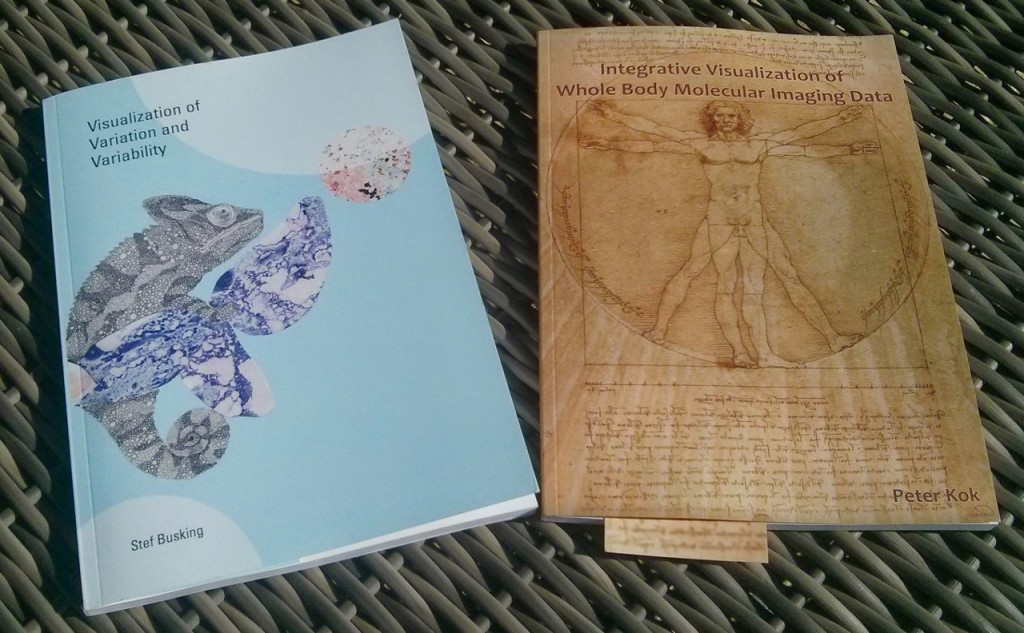
In the evening we hiked up through the vineyards of Vienna to the main social event: dinner at the Waldgrill Cobenzl. The view on the vineyards and Vienna itself was really stunning. We enjoyed a delicious buffet dinner accompanied by Sturm. Sturm is grape juice that has just started fermenting and is only available for a limited time every year, so we were lucky VCBM was held in Vienna exactly during Sturm time. After dinner the winners of the Karl-Heinz Höhne Award for Medical Visualization were announced:
https://twitter.com/eg_vcbm/status/507612533226627073
I would love to tell you who the winner’s were, but the official announcement has not been made yet ;), so I don’t dare… Congratulations to the award winnners nonetheless, you know who you are ^^.
On the second and last day of VCBM there were sessions on Volume Visualization, Image Registration and Data Reconstruction for Medical Interventions, Visual Explanations and Display Techniques as a keynote by Nigel John entitled ‘Visual Computing in Healthcare – from the Research Lab into the Hospital”. In the keynote he presented several case studies and discussed some of the challenges
involved in deploying visual computing solutions in a hospital setting.
- Volume Visualization:
- Veronika Solteszova and Åsmund Birkeland presented their work on
“Visibility-Driven Processing of Streaming Volume Data” [6], in which they propose a visibility-driven processing scheme for handling costly
on-the-fly processing of volumetric data in real-time for real-time volume data acquisitions: - Stefan Lindholm gave an interesting talk entitled “Towards Clinical Deployment of Automated Anatomical Regions-Of-Interest” [7]. In his work he proposes an Automatic and Anatomical ROI (AA-ROI) approach based on the combination of automatic image registration (AIR) and distance-based Transfer Functions (DBTFs), designed for automatic selection of complex anatomical shapes without relying on excessive amounts of interaction:

Towards Clinical Deployment of Automated Anatomical Regions-Of-Interest
- Veronika Solteszova and Åsmund Birkeland presented their work on
- Image Registration and Data Reconstruction for Medical Interventions:
- At the risk of tooting my own horn, I gave a talk on “RegistrationShop: An Interactive 3D Medical Volume Registration System” [8], developed to improve and simplify the process of volume registration with 3D visualizations and
simple interactive tools. The source code is available here, talk slides are here, and this is a demo video:
- At the risk of tooting my own horn, I gave a talk on “RegistrationShop: An Interactive 3D Medical Volume Registration System” [8], developed to improve and simplify the process of volume registration with 3D visualizations and
- Visual Explanations and Display Techniques:
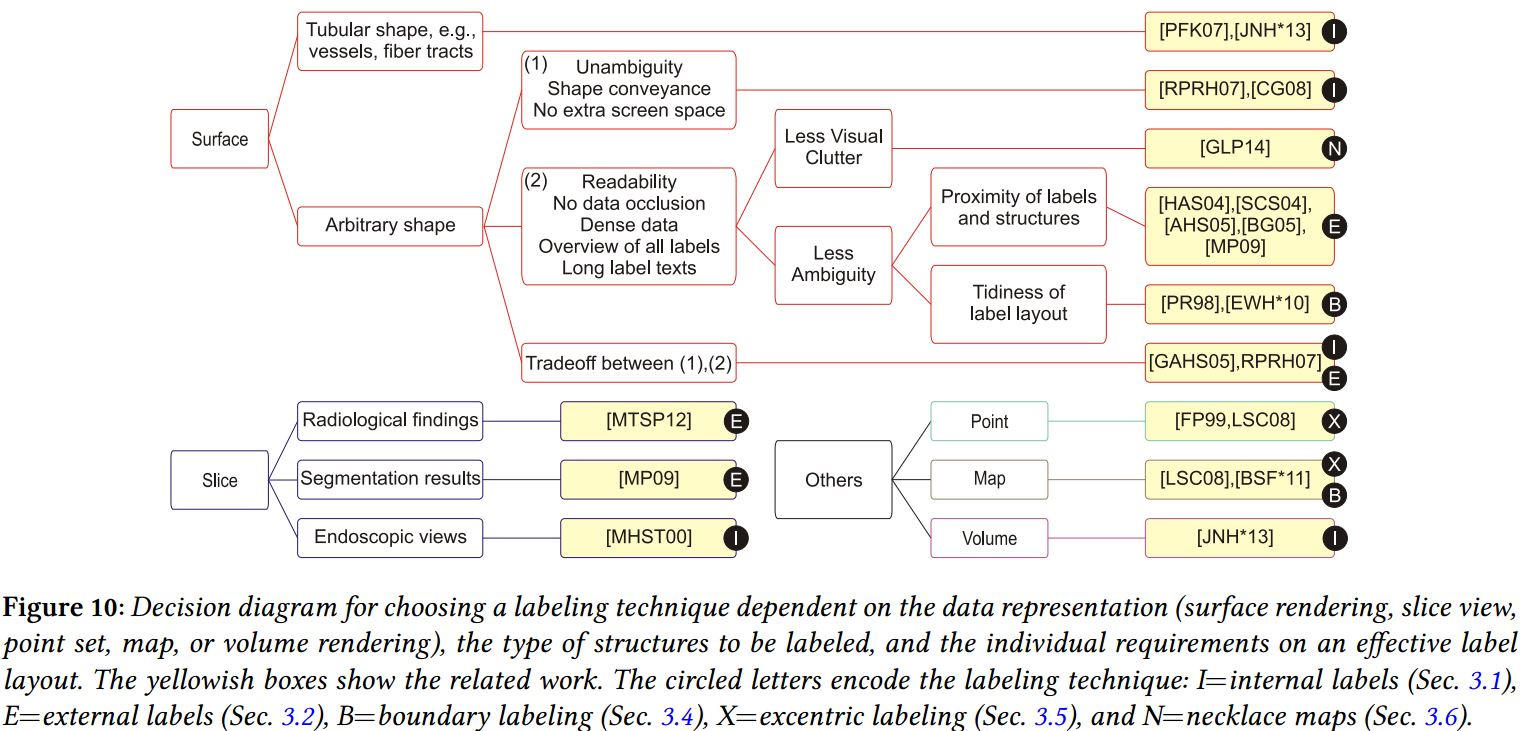
- Steffen Oeltze-Jafra delivered another interesting talk, this time a useful “Survey of Labeling Techniques in Medical Visualizations” [9]. I especially enjoyed his proposed decision diagram, to quickly assess what the best labelling technique for your specific problem is:
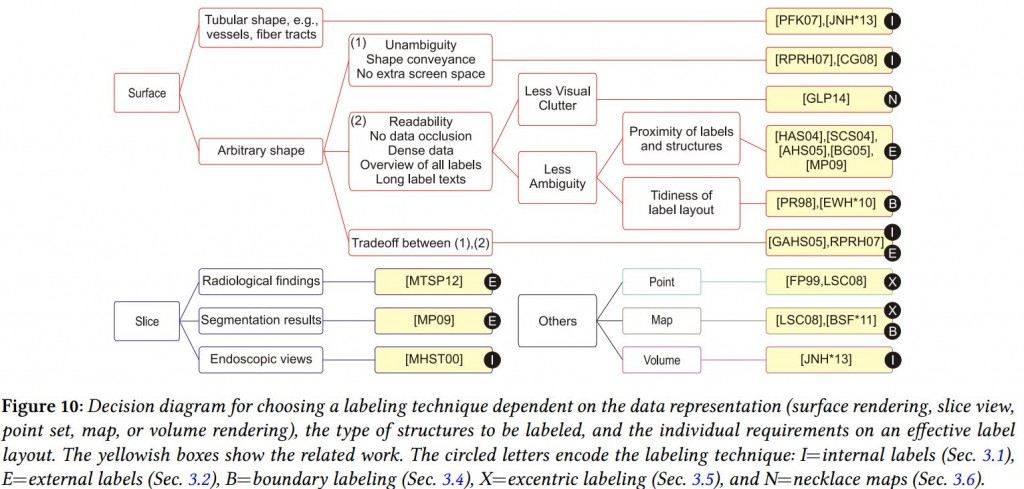
- Steffen Oeltze-Jafra delivered another interesting talk, this time a useful “Survey of Labeling Techniques in Medical Visualizations” [9]. I especially enjoyed his proposed decision diagram, to quickly assess what the best labelling technique for your specific problem is:
VCBM wrapped up with the awards ceremony. The best paper award went to:
https://twitter.com/medvisorg/status/507881666946564096
The honorable mentions can be found here. Our congratlations to the authors! Ivan Viola closed the conference and announced the location for next year (this year by now ^^): VCBM 2015 will be held in Bangor (UK) and will from now on be an annual workshop instead of bi-annual (once every two years, not the twice every year-type). To conclude this summary, I’d really like to thank the organizers of this excellent workshop. Interesting talks, a beautiful location, good food, great people once again!
References:
- [1]: Robust Cardiac Function Assessment in 4D PC-MRI Data. Köhler, Benjamin; Preim, Uta; Gutberlet, Matthias; Fischbach, Katharina; Preim, Bernhard
- [2]: The iCoCooN: Integration of Cobweb Charts with Parallel Coordinates for Visual Analysis of DCE-MRI Modeling Variations. Raidou, Renata; Breeuwer, Marcel; Vilanova, Anna
- [3]: Extracting and Visualizing Uncertainties in Segmentations from 3D Medical Data. Faltin, Peter; Chaisaowong, Kraisorn; Kraus, Thomas; Merhof, Dorit
- [4]: Interactive Labeling of Toponome Data. Oeltze-Jafra, Steffen; Pieper, Franz; Hillert, Reyk; Preim, Bernhard; Schubert, Walter
- [5]: Visual and Quantitative Analysis of Higher Order Arborization Overlaps for Neural Circuit Research. Swoboda, Nicolas; Moosburner, Judith; Bruckner, Stefan; Yu, Jai Y.; Dickson, Barry J.; Bühler, Katja
- [6]: Visibility-Driven Processing of Streaming Volume Data. Solteszova, Veronika; Birkeland, Åsmund; Viola, Ivan; Bruckner, Stefan
- [7]: Towards Clinical Deployment of Automated Anatomical Regions-Of-Interest. Lindholm, Stefan; Forsberg, Daniel; Ynnerman, Anders; Knutsson, Hans; Andersson, Mats; Lundström, Claes
- [8]: RegistrationShop: An Interactive 3D Medical Volume Registration System. Smit, Noeska; Klein Haneveld, Berend; Staring, Marius; Eisemann, Elmar; Botha, Charl; Vilanova, Anna
- [9]: Survey of Labeling Techniques in Medical Visualizations. Oeltze-Jafra, Steffen; Preim, Bernhard