International Science & Engineering Visualization Challenge 2012 Winners

The annual International Science & Engineering Visualization Challenge organized by the National Science Foundation (NSF) and the journal Science has just announced the winners of 2012. Several winners have contributed medical visualizations:

A malignant brain tumor (red mass, left) of this person’s brain, wreathed by fine tracts of white matter. The red fibers signal danger: If severed by the neurosurgeon’s scalpel, their loss could affect the patient’s vision, perception, and motor function. Blue fibers show functional connections far from the tumor that are unlikely to be affected during surgery. Together, the red and blue fibers provide a road map for neurosurgeons as they plan their operations. Computer science graduate student Maxime Chamberland of the Sherbrooke Connectivity Imaging Lab in Canada produces images like these on a weekly basis, he says. Using an MRI technique that detects the direction in which water molecules move along the white matter fibers, he generates a three-dimensional image of functional connections in the brain.

Cerebral Infiltration. Credit: Maxime Chamberland, David Fortin, and Maxime Descoteaux, Sherbrooke Connectivity Imaging Lab

This image is an artistic rendering of Alya Red, a new computer model of the heart that marries modern medical imaging techniques with high-powered computing. Based on MRI data, each colored strand represents linked cardiac muscle cells that transmit electrical current and trigger a model human heartbeat. Despite centuries of study, scientists are still largely baffled by the heart’s complex electrical choreography, says physicist Fernando Cucchietti, who helped produce the video. The most challenging part was to get the heart fibers in the image to move in a realistic way, Cucchietti says.

Alya Red: A Computational Heart. Credit: Guillermo Marin, Fernando M. Cucchietti, Mariano Vázquez, Carlos Tripiana, Guillaume Houzeaux, Ruth Arís, Pierre Lafortune, and Jazmin Aguado-Sierra, Barcelona Supercomputing Center

Check out these and all the other winners here. If you’d like to compete in the 2013 challenge, the competition opens in February (tomorrow!) and the deadline for your submission is the end of September 2013.

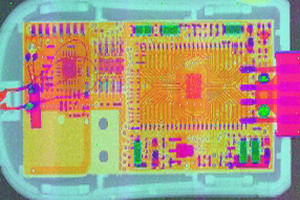
3D Colour X-Ray Imaging

Researchers at the University of Manchester have successfully developed a camera capable of taking 3D colour x-ray images in near-real time. The team is currently working on a the first colour CT scanner. Professor Robert Cernik:

“Current imaging systems such as spiral CAT scanners do not use all the information contained in the X-ray beam. We can use all the wavelengths present to give a colour X-ray image in a number of different imaging geometries. This method is often called hyperspectral imaging because it gives extra information about the material structure at each voxel (3D equivalent of a pixel) of the 3D image. This extra information can be used to fingerprint the material present at each point in a 3D image.”

In a recent experiment the team used the technology to X-ray a USB dongle that controls webcams.

The technology is currently being developed in a laboratory setting, but it will be interesting to see what impact this new modality will have on medical imaging. More information about these new developments can be found here.

medvis.org 2012 summary

First of all, happy new year from all of us at medvis.org! May 2013 bring you many job opportunities, research successes and/or good medical visualizations. I’d like to start the new year by looking back at last year briefly. I’ve taken a look at some of our blog statistics and will provide a short summary for those interested below:

2013 IEEE Scientific Visualization Contest: Developmental Neuroscience Challenge

I suppose the theme of the 2013 IEEE Scientific Visualization Contest (a VisWeek 2013 event) is strictly speaking more biovis than medvis, but I thought I’d still mention it here, since the fields are so closely related. In any case, the theme for this year’s scivis contest is developmental neuroscience! There is a dataset available (the Allen Developing Mouse Brain Atlas) tracking the level of gene expression for 2000 genes in 6 stages, organized into 11 categories, in a 3D mouse brain. So that’s a grand total of 12000 expression energy volumes at your disposal.

The challenge is to visualize gradients, structural patterns, structure consistency and complementary patterns for the complete dataset. If you’re up for participating in this contest, you can find more information here. The deadline for the contest is 31 July 2013.

And the MedVis-Award 2012 goes to…. Rocco Gasteiger of the University of Magdeburg!

Every two years the VCBM group awards the Karl-Heinz Höhne Award for Medical Visualization to a young scientist in the MedVis field. Candidates for this award focus their innovative research on visualizations clearly related to medical questions.

This year, the MedVis award was won by Rocco Gasteiger, of the University of Magdeburg Visualization Group. He has won this award for his work on the visual exploration of cerebral blood flow in aneurysms.

Teaser image from ‘Automatic Detection and Visualization of Qualitative Hemodynamic Characteristics in Cerebral Aneurysms’ [2].

We would like to congratulate Rocco and the Magdeburg Visualization group with this well-deserved award. If you want to find out more about Rocco’s work, you might want to check out his two IEEE TVCG papers, presented at VisWeek 2011 and 2012:

Report on the Medical Visualization highlights of VisWeek 2012

(We are once again very happy and grateful that Dr. Steffen Oeltze from the University of Magdeburg Visualization Group could write this short report on the medical visualization-related papers at IEEE VisWeek 2012 for us.)

This year, IEEE VisWeek hosted no special session dedicated to medical visualization but
five contributions to this field were spread over the conference program.

Jian Chen from the University of Maryland gave a talk on how stereo and screen size effect the legibility of three-dimensional streamtube visualizations. The effects were studied in the context of visually exploring dense fiber tracts reconstructed from diffusion magnetic resonance imaging data. A user study comprising 12 participants who had to perform five different tasks, e.g., find the endpoints of fiber tracts and judge if tracts belong to the same bundle, was carried out. In contrast to the initial hypotheses of Chen and
colleagues, completion time did not improve by using a larger display and performance accuracy was even hurt by introducing stereo. See the paper for further exploration of the results [1].

Rocco Gasteiger from the University of Magdeburg, Germany gave a compelling talk on the automatic detection and visualization of qualitative hemodynamic characteristics in cerebral aneurysms. He focused on the so-called inflow jet and the impingement zone, both being characteristics which are correlated with the risk of aneurysm rapture. Special care was taken in generating expressive visualizations of the detected features by means of glyphs, texture, Fresnel shading, and surface contours. The work was rounded off by a user study involving six domain experts who show high interpersonal variance in manually specifying the features but agreed on the good value of the presented visualizations [2]. A supplemental video can be watched here:

Markus Hadwiger from the King Abdullah University of Science and Technology, Saudi Arabia presented the first volume visualization system that scales to petascale volumes imaged as a continuous stream of high-resolution electron microscopy images. Markus and his team developed the system in collaboration with neuroscientists who wish to analyze brain function by measuring large blocks of brain tissue. The system can accept a constant stream of 2D image tiles from a microscope thereby handling missing data naturally and avoiding the expensive computation of any 3D multi-resolution representation such as an octree. A novelty of the system is that most computations are restricted to the currently visible volume data [3]. Watch the accompanying video here:

http://vimeo.com/50886921

Alexander Bock from the Linköping University, Sweden presented the ray-casting of high-order finite element (FE) models for visualizing and analyzing strain of the human heart muscle. A straightforward ray-casting approach is inadequate for interactive data exploration due to the computational complexity of transforming the sample points along each ray into the non-uniform grid of the FE model. Hence, Alexander and his colleagues decoupled the expensive transformation from the rendering stage by means of proxy rays cast in FE space, thereby allowing it to be performed within a precomputation stage. The nice work was rounded off by an analysis of the error that is introduced by the presented approach [4].

Gunnar Läthén, also from the Linköping University, Sweden, gave a talk on improving transfer functions for volume rendering blood vessels in computed tomography angiography (CTA) data [5]. These data are acquired by means of injecting a contrast agent, which leads to an enhancement of the vessels. Due to variations in mixture concentration of contrast agent in the blood stream, the enhancement varies locally and transfer function presets often do not yield optimal images. Hence, Gunnar and his colleagues propose an automatic, optimization-based method that shifts transfer function presets to account for general deviations and local variations of the intensity of contrast enhanced blood vessels. The method is illustrated for clinically relevant CT angiography datasets.

edited to add: I’ve received a tip from an anonymous reader that those interested in direct volume rendering might want to take a look at this work, which was also presented at VisWeek this year by Daniel JönssonHistorygrams: Enabling Interactive Global Illumination in Direct Volume Rendering using Photon Mapping [6]

Example rendering from ‘Historygrams: Enabling Interactive Global Illumination in Direct Volume Rendering using Photon Mapping’.

References

PhD position Uncertainty Visualization for Digital Radiation Therapy available at Eindhoven University of Technology (the Netherlands)

Eindhoven University of Technology and more specifically the Department of Biomedical Engineering have a PhD position available on the interesting topic of uncertainty visualization for digital radiotherapy planning in the Multivalued Image Analysis & Visualization group led by dr. Anna Vilanova. This project is part of the FP7 EU-STREP project ‘DR THERAPAT’- Digital Radiation Therapy Patient’. The goal of this project is to achieve an easy-to-use and easy-to-understand visualization and exploration of the multimodal, multi-value data involved in cancer radiotherapy planning – including the uncertainty in these data – in each step of the radiotherapy planning pipeline and in the final planning outcome.

More information on this position can be found here. Don’t miss this excellent opportunity if you’re interested and apply before the application deadline (the 29th of December 2012).

Research Software Programmer job opening at the Computational Radiology Laboratory in Boston (USA)

The Computational Radiology Laboratory (CRL) at the Children’s Hospital in Boston are looking for a programmer to work on several research projects in medical image computing. You would be involved in developing software with other CRL members and clinical research teams in the fields of registration, segmentation, visualization, medical image computing and diffusion imaging analysis. For this you need to be excellent at C++ coding and to have experience with ITK, VTK and Qt among other requirements.

An example of Multiple Scelerosis research done at CRL: a high resolution single subject atlas of white matter fiber tracts.

Read this if you want to find out more about this position. The closing date is the first of November, so apply soon if you’re interested in this.

Kitware is looking for Developers and Project Leaders in North Carolina (USA)

Kitware (of open-source software such as ITK, VTK, Slicer and CMake fame) is currently looking for Developers and Project Leaders for their office in North Carolina. As a project leader, you would be working together with commercial and academic collaborators on a wide range of imaging, scientific computing, informatics, computer vision, software engineering and data management projects. You need strong software technology and project management skills for this. They are also looking for C++ developers at both the BSc and Msc levels in computer science. For this, of course, they prefer experience with Qt, software design patterns and Kitware’s own software libraries.

If you’ve always wanted to become a Kitwarean (I did not make this up, I swear!), more details can be found here. The closing date for these positions is Monday, December 31, 2012. Like Kitware, but not these positions or this location? There’s even more open Kitware positions right here.

P.S. To our readers attending VisWeek this year: enjoy!

EG VCBM 2012 Norrköping (Sweden) Report

I started writing this post in the train from Norrköpping back to Stockholm Arlanda airport after visiting the truly excellent EG VCBM 2012 (Eurographics Workshop on Visual Computing for Biology and Medicine). While enjoying the beautiful view on the stunning Swedish landscape that features many lakes, trees with autumn leaves and a nice autumn sun, I briefly summarized the conference highlights. Please note that these were the conference highlights for me personally, and are not necessarily a reflection of the actual conference highlights. There were so many great talks, I lost count, but in the interest of not making this blog post drag on for too long, I’ll restrict myself to just briefly summarizing a couple of them here.

The first day started with a word of welcome from the chairs Timo Ropinski and Anders Ynnerman and an excellent keynote by Anders Persson (Director of the CMIV): ‘Visualization of Quantified Medical Image Data – Key to the Future?’. While showing us beautiful datasets acquired from Dual Energy CT (DECT), he stressed the importance of making quantified imaging data usable in clinical practice. This can be achieved by working in close collaboration with medical centers to make sure the techniques we are developing are usable by and useful to clinicians or medical researchers.
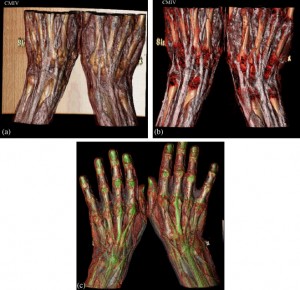
Dual-energy CT (DECT) with two X-ray sources running simultaneously at different energies allows obtaining additional information about the elementary chemical composition of computer tomography scanned material [1].

The first session of the first day, Tractography and Connectivity, featured a talk by Anne Berrescalled ‘Tractography in Context: Multimodal Visualization of Probabilistic Tractograms in Anatomical Context’ [2]. Her approach is a way of handling the visibility issues that arise when presenting probabilistic tractograms within anatomical context. Probabilistic tractography data is presented in a ‘glass brain’ rendering that provides anatomical context together with an MRI slice plane, in a collaboration with neurological domain experts.
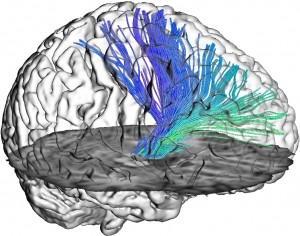
Tractography data in anatomical context [2].

In the Ultrasound session, the talk by Daniel Tenbrinck entitled ‘Impact of Physical Noise Modeling on Image Segmentation in Echocardiography’ really stood out for me [3]. Not only was it presented extremely skillfully, but the authors made a convincing argument against the frequently used Gaussian noise model assumption and demonstrated the positive effect of chosing a more suitable model such as the Loupas model. In this same session, Veronika Solteszova and Linn Emilie Saevil Helljesenpresented a new way of filtering 3D ultrasound using lowest-variance streamlines that reduces noise in 3D ultrasound datasets with impressive results [4].

Raw 3D ultrasound scan on the left and a visualization of the same dataset filtered with the lowest-variance streamline method [4].

The final session of the day, on Multimodality included a great talk by Florian Weilerpresenting his work ‘On the Value of Multi-Volume Visualization for Preoperative Planning of Cerebral AVM Surgery’ [5]. In the surgical treatment of cerebral arteriovenous malformations (AVMs), thorough preoperative planning is required using information about the arteries and veins of the lesion from different image sets. The authors merge these image sets and visualize them in an interactive application.
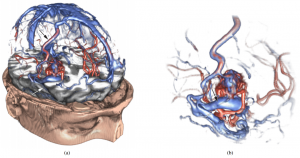
Multi-Volume Visualization for Preoperative
Planning of Cerebral AVM Surgery [5].

Before making our way to the conference dinner, we were given a very special tour of the universe by Anders Ynnerman. I’m typically not at all interested in space stuff, but this was something else! Anders actually showed us the entire universe in the Dome, using real data from NASA. Besides the visually stunning features of this tour, Anders managed to make it a truly amazing experience by providing commentary full of interesting anecdotes and impressive facts. The feeling that you get when experiencing all this is very hard to describe, so I will not even try. But I will say this though, if you’re ever in the area and get the chance to see this, go for it!

On the second conference day, the Segmentation and Simulation session’s second talk presented by Frank Heckel ‘Sketch-based Image-Independent Editing of 3D Tumor Segmentations Using Variational Interpolation’ was also very interesting [6]. By allowing the user to intuitively draw adjustments on single slices, automatic segmentations can easily be adjusted by medical experts. This is currently shown on CT, but since the adjustments are not image-based, the technique is valid for arbitrary modalities.
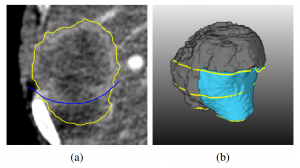
Sketch-based segmentation editing: (a) initial segmentation (yellow), manual correction (blue) and (b) 3D result after editing with our variational-interpolation-based approach [6].

After this session, the Visual Computing Systems session started with the impressive ‘Visually Guided Mesh Smoothing for Medical Applications’ talk by Tobias Moench [7]. The authors provided a way of interactively smoothing a mesh by trying out several parameters and simultaneously show the effect of these settings on mesh quality by using a GPU mesh smoothing implementation. By calculating the model quality for several parameter combinations, an optimal set of smoothing parameters can be automatically suggested as well (click to see a cool realtime mesh smoothing video).

The medvis.org overlord who also happens to be my supervisor, Charl Botha, presented ‘BrainCove: A Tool for Voxel-Wise fMRI Brain Connectivity Visualization’ in the same session [8]. I am obviously biased here, but I thought it was an interesting and entertaining presentation. I mean it featured the BrainCleaver, what’s not to like?
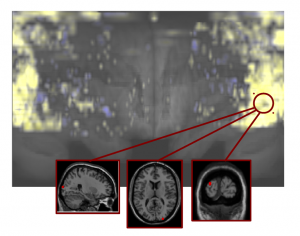
Braincove’s Lambert’s Cylindrical flatmap representation
of the brain, viewing from the anterior in the middle to posterior at the two sides [8].

The final session of the second day, Biology and Radiology, was concluded with an excellent talk by Katja Mogalle ‘Constrained Labeling of 2D Slice Data in Clinical Application’ [9]. Katja did this as her bachelor project (yes, you read that right!) with Siemens. She has thought of an algorithm that uses constraints to place annotation labels in 2D slice data so that they don’t occlude the image, but are close enough to be linked to the area that they describe.
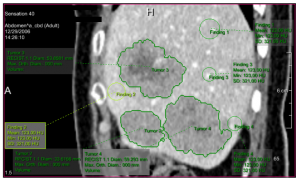
Placement of seven labels in a viewport showing a liver via the shifting approach [9].

Unfortunately we had to catch a flight, so we had to miss the keynote. The best paper award went to “Atomistic Visualization of Mesoscopic Whole-Cell Simulations” presented by Martin Falk and the best poster was “Efficient projection and deformation of volumetric shape and intensity models for accurate simulation of X-ray images” presented by Moritz Ehlke. My personal favorites of all the talks were the ones by Daniel Tenbrinck, Tobias Moench and Katja Mogalle. To conclude this already far too lengthy post, I’d really like to thank the organizers of this excellent workshop. Interesting talks, a beautiful location, good food, great people and a guided tour of the universe. I’m not sure how any conference will ever top this!

References

  • [1] Anders Persson, Christian Jackowskia, Elias Engström and Helene Zachrisson, “Advances of dual source, dual-energy imaging in postmortem CT”, European Journal of Radiology, Volume 68, Issue 3, December 2008, Pages 446–455
  • [2]: Anne Berres, Mathias Goldau, Marc Tittgemeyer, Gerik Scheuermann and Hans Hagen, “Tractography in Context: Multimodal Visualization of Probabilistic Tractograms in Anatomical Context”
  • [3]: D. Tenbrinck, A. Sawatzky, X. Jiang, M. Burger, W. Haffner, P. Willems, M. Paul and J. Stypmann “Impact of Physical Noise Modeling on Image Segmentation in Echocardiography”
  • [4]: Veronika Šoltészová, Linn Emilie Sævil Helljesen, Wolfgang Wein, Odd Helge Gilja and Ivan Viola, “Lowest-Variance Streamlines for Filtering of 3D Ultrasound”
  • [5]: F. Weiler, C. Rieder, C. A. David, C. Wald, and H. K. Hahn “On the Value of Multi-Volume Visualization for Preoperative Planning of Cerebral AVM Surgery”
  • [6]: F. Heckel, S. Braunewell, G. Soza, C. Tietjen and H. K. Hahn, “Sketch-based Image-independent Editing of 3D Tumor Segmentations using Variational Interpolation”
  • [7]: Tobias Moench, Christoph Kubisch, Kai Lawonn, Ruediger Westermann and Bernhard Preim,”Visually Guided Mesh Smoothing for Medical Applications”
  • [8]: A.F. van Dixhoorn, J. Milles, B. van Lew and C.P. Botha “BrainCove: A Tool for Voxel-wise fMRI Brain Connectivity Visualization”
  • [9]: Katja Mogalle, Christian Tietjen, Grzegorz Soza and Bernhard Preim, “Constrained Labeling of 2D Slice Data for Reading Images in Radiology”