PhD Position in Medical Visualization available at VRVis in Vienna (Austria)

The second position mentioned in this post is still available! To reiterate, they are looking for an Early Stage Researcher in the EU Initial Training Network (ITN) Software for the use of Multi-Modality Images in External Radiotherapy (SUMMER).

They are looking for a motivated young scientist that would love to use medical visualization to aid in the development of cutting edge solutions for radiotherapy planning. The starting date is as soon as possible, but before January 1, 2013. If you are interested in this position, please check this page for more details or contact Katja Bühler (buehler@vrvis.at) via e-mail. If you’re currently attending MICCAI 2012, you could also arrange to meet her there via e-mail.

Sectra Visualization Table

I just got back home from the excellent EG VCBM 2012 conference and am currently working on my conference highlights write-up. In the meanwhile though, I wanted to show you a video of something else I saw at VCBM: the Sectra Visualization Table. It can be used for surgical planning, medical education and virtual autopsies, but it probably would be quite the conversation starter at a dinner party as well 😉 We have posted about this before two years ago, but I think this new video shows off the cool features better:

This is an excellent example of a good collaboration between research and industry. More information about it can be found here and here. I so wouldn’t mind having one of these to play around with ^^

Registration still possible for VCBM (aka Eurographics Workshop on Visual Computing for Biology and Medicine) next week!

Next week on September 27 to 28 the third edition of the Eurographics Workshop on Visual Computing for Biology and Medicine (VCBM) will be in full swing in Norrköping, Sweden. For us medical visualizationers (is that even a word?) this is one of the most important events to attend, in my humble opinion, because the topics presented are all uniquely relevant to the medvis field. Just take a look at the program and you’ll see what I mean.

In any case, I wanted to let you know it is still possible to register for this amazing event here and that I hope to meet you all there! I (Pelvis Lady) am presenting a poster with Thomas Kroes (aka Exposure Render Guy), so come say hi if you like 🙂

Associate Professor in Biomedical Image Analysis position available at Eindhoven University of Technology (the Netherlands)

Eindhoven University of Technology is looking for an associate professor in biomedical image analysis (BMIA). The scientific research in the group BMIA focuses on three closely intertwined areas:

  • Design of advanced mathematical algorithms
  • Visualization of multi-valued data
  • Cardiovascular and neuro applications
You’d be working at the Imaging Science and Technology Eindhoven Institute (IST/e), which aims to grow to a leading research institute on the crossroads of image acquisition, mathematical modeling, algorithmics, visualization and biomedical applications of complex images or image sequences on the basis of advanced acquisition techniques. The group has a strong collaboration with Philips Healthcare and Philips Research (both 4 km away), and a range of (international) hospitals.
Check out the full job description and apply here. There’s some conflicting information on the closure date of this position, but I see 31-10-2012 on a lot of pages (here and here for instance), so I assume it is still open. update: the closing date for this position is 31-12-2012.

3D Software Engineer job opening at Anatomage in San Jose, California (USA)

If you like anatomy, enjoy software engineering and are looking for a job, this post might be right up your ally. Anatomage, a company specializing in 3D medical technology, is looking for a 3D software engineer. Your tasks would include writing software for visualizing 3D volumetric imaging data read from DICOM files, developing geometric modeling algorithms and user interface for creating and manipulating 3D models from image data, preparing software documentation including the functional specifications and reference manual and providing technical support to customers.

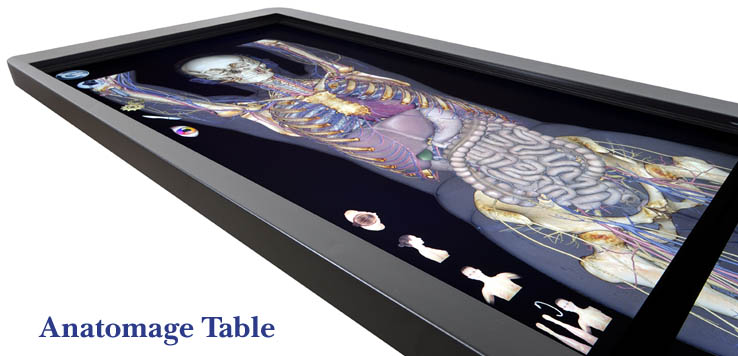
Anatomage Table

The Anatomage Table, a life-size virtual dissection table for the medical community, is an example of one of the products made by Anatomage.

More information about Anatomage can be found on their website and the full job description is available here.

Research Associate Advanced Medical Image Analysis and Visualization position open at Cardiff University (UK)

There’s a 1-year Research Associate position available at Cardiff University in the School of Computer Science & Informatics to work on projects within the Advanced Medical Image Analysis and Visualization department collaborating with the NHS in Wales and Aberystwyth, Bangor and Swansea Universities. You will undertake novel and high quality research within the Advanced Medical Image Analysis and Visualization Unit, working closely with Professor N J Avis. All you need for this is a doctorate degree in computer science, mathematics, or engineering or in a closely related area or equivalent experience.

More information can be found here and here and detailed information can be found by searching the Cardiff jobs site for vacancy number 307BR. The closing date is the 7th of September and thus rapidly closing in 😉

Rainbow Colormaps – What are they good for? Absolutely nothing!

I’m probably preaching to the visualization choir here, but hopefully this could be helpful for newcomers to the field. This post is based on information given to me by my PhD-supervisor/anti-rainbow-colormap-activist Charl Botha. I’ll start off by explaining why rainbow colormaps are almost never a good choice with some references and will provide some good alternatives and resources at the end.
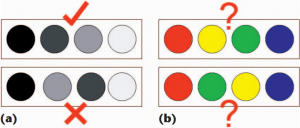
There are two main problems with using a rainbow colormap in (medical) visualization. The first is that it doesn’t have a natural ordering. If you ask people how they would rank yellow and blue, they have to guess. There is of course order in there (shorter to longer wavelength of light), but it’s not perceptually ordered [1].
Perceptual Ordering

Perceptual ordering. (a) We can easily place the gray paint chips in order based on perception, (b) but cannot do this with the colored chips. [1]

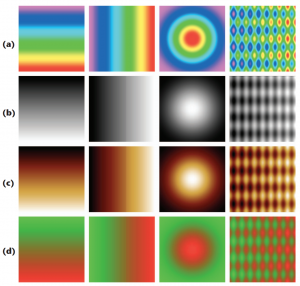
 The second problem is that it’s not perceptually linear, so equal distances in the scale do not appear equally different color-wise. For example, people perceive the 1st and the 5th colors in your colormap to be much more different than the 5th and the 9th, when these colors would be assigned to data-values that differ by identical amounts.This is actively misleading users. Furthermore, it introduces artifacts: There are perceived sharp transitions in data at the sharp transitions between hues [1]. In the figure below this effect is clearly visible on an artificial dataset:
Rainbow Artifacts

Four data sets visualized with (a) rainbow, (b) gray-scale, (c) black-body radiation, and (d) isoluminant green–red color maps. Apparent sharp gradients in the data in (a) are revealed as rainbow color map artifacts, not data features, by comparing this row with the same data viewed using the other color maps. conversely, the sharp gradient found at the center of the second data set (see the second column) shown in the gray-scale and  blackbody radiation (and to a lesser extent, the isoluminate green–red) images is not found in the corresponding image with the rainbow color map. [1]

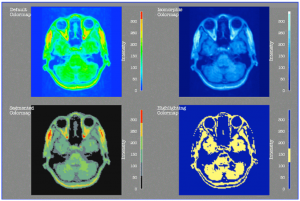
This figure shows the same effect on a MRI scan of the head. The rainbow colormap creates perceived contours where there are none in the data, so that structures within these bands are not represented. On top of that attention is drawn to the yellow areas, because they are the brightest, but not necessarily the most important [2]:
Head MRI Colormap

Four colormaps applied to a slice of an MRI scan of a human head. They demonstrate how the representation can influence the
interpretation of the data. [2]

  So by now, you may be asking yourself: ‘If you hate the rainbow colormap so much, why don’t you come up with a better one?’ The answer to this is, people have! But despite all the warnings, in the IEEE Visualization Conference proceedings of 2005, 52% of the medical papers and 59% of the non-medical papers still used the rainbow colormap [1]. In any case, here are some alternatives you could consider (from [1], with examples added):
  • For nominal data (data that doesn’t have implied order): use a selection of distinct colors. A good choice is a qualitative scheme from colorbrewer2.org, for example this colorblind safe four color qualitative scheme:
  • For high-frequency ordinal data (data that does have order but no distance metric, including medical images): use gray-scale or heated body scale, for example the Gray colormap from Matlab or the Heated-Object scale colormap from Haim Lefkowitz’ color center.
  • For colormaps on a surface: use an isoluminant colormap such as a saturation scale from for instance red to green or a double-ended scale like green to gray to red.
  • For interval (measurable distances) and ratio (measurable distances and zero point) data: use a double-ended scale. The double-ended scale can be useful to indicate on which side of the zero a region lies. For instance if your scale goes from purple to white to green, the purple values will be below zero, while the green values will be above.

Besides just not using the rainbow colormap, you might also want to take factors like colorblind safety and printer friendliness (for papers) into account. To conclude this post, here are some resources you can use to pick a cool (or hot) colormap for your visualization needs:

  • Colorbrewer: officially color advice for cartography, but has cool interactive features to see the effects of a chosen colormap on several types of data.
  • Haim Levkowitz’s color center: features downloadable perceptually linear colour maps, including the heated-object scale.
  • Matlab colormaps: Matlab has some pretty colormaps built in, like the heated body ‘Hot’ and other perceptually linear colormaps like Gray, Summer, Bone and Pink.  Just stay away from those rainbows please 🙂
  • Perceptually improved colormaps for Matlab: three perceptual colormaps with rainbow-like colors for interval data and a colormap for ratio data.
  • Update: I have written a follow-up post on four new beautiful perceptually linear colormaps designed for Matplotlib, but free to use anywhere.

References

Postdoc position medical image analysis and visualization available in London (Canada)

Another day, another job opportunity! This time the Digital Imaging Group of London (the Canada version) has a postdoctoral fellowship available in medical image analysis and visualization in collaboration with GE Healthcare. You’d be doing cutting-edge research with researchers from GE Healthcare, Western University, Robarts Research Institute, Lawson Health Research Institute and the London Health Sciences Centre. The work also involves direct interaction with radiologists.
More information about this excellent opportunity can be found here.

Medical Visualization Ph.D. position available at Graz University of Technology (Austria)

There’s a Ph.D. position available in the exciting research field of medical visualization at Graz University of Technology in Austria. The project you’d be working on involves the visualization of minimally invasive intervention simulation, such as RFA or cryoablation for cancer treatment .

The start date for the position in this EU-funded project is the first of January in 2013, so start sending in those applications! More information can be found here.

The medvis.org Conference Calendar

Inspired by the world-famous VRVis conference calendar at http://confcal.vrvis.at/, I’ve added and maintaining our very own medvis.org medical visualization conference calendar. It features a full calendar view here and some imminent dates appear in the sidebar of this website to the right. The goal of this is to get a quick overview of upcoming submission deadlines, notification dates and conference dates for venues that are known to feature medical visualization research. The full calendar view also allows you to import one or more of the the submission deadline, notification and conference calendars to your own calendar.

It’s still a work in progress for now, so please contact me or leave a comment here if you have an update or addition to suggest.